Performance regression testing for Unreal Engine 5
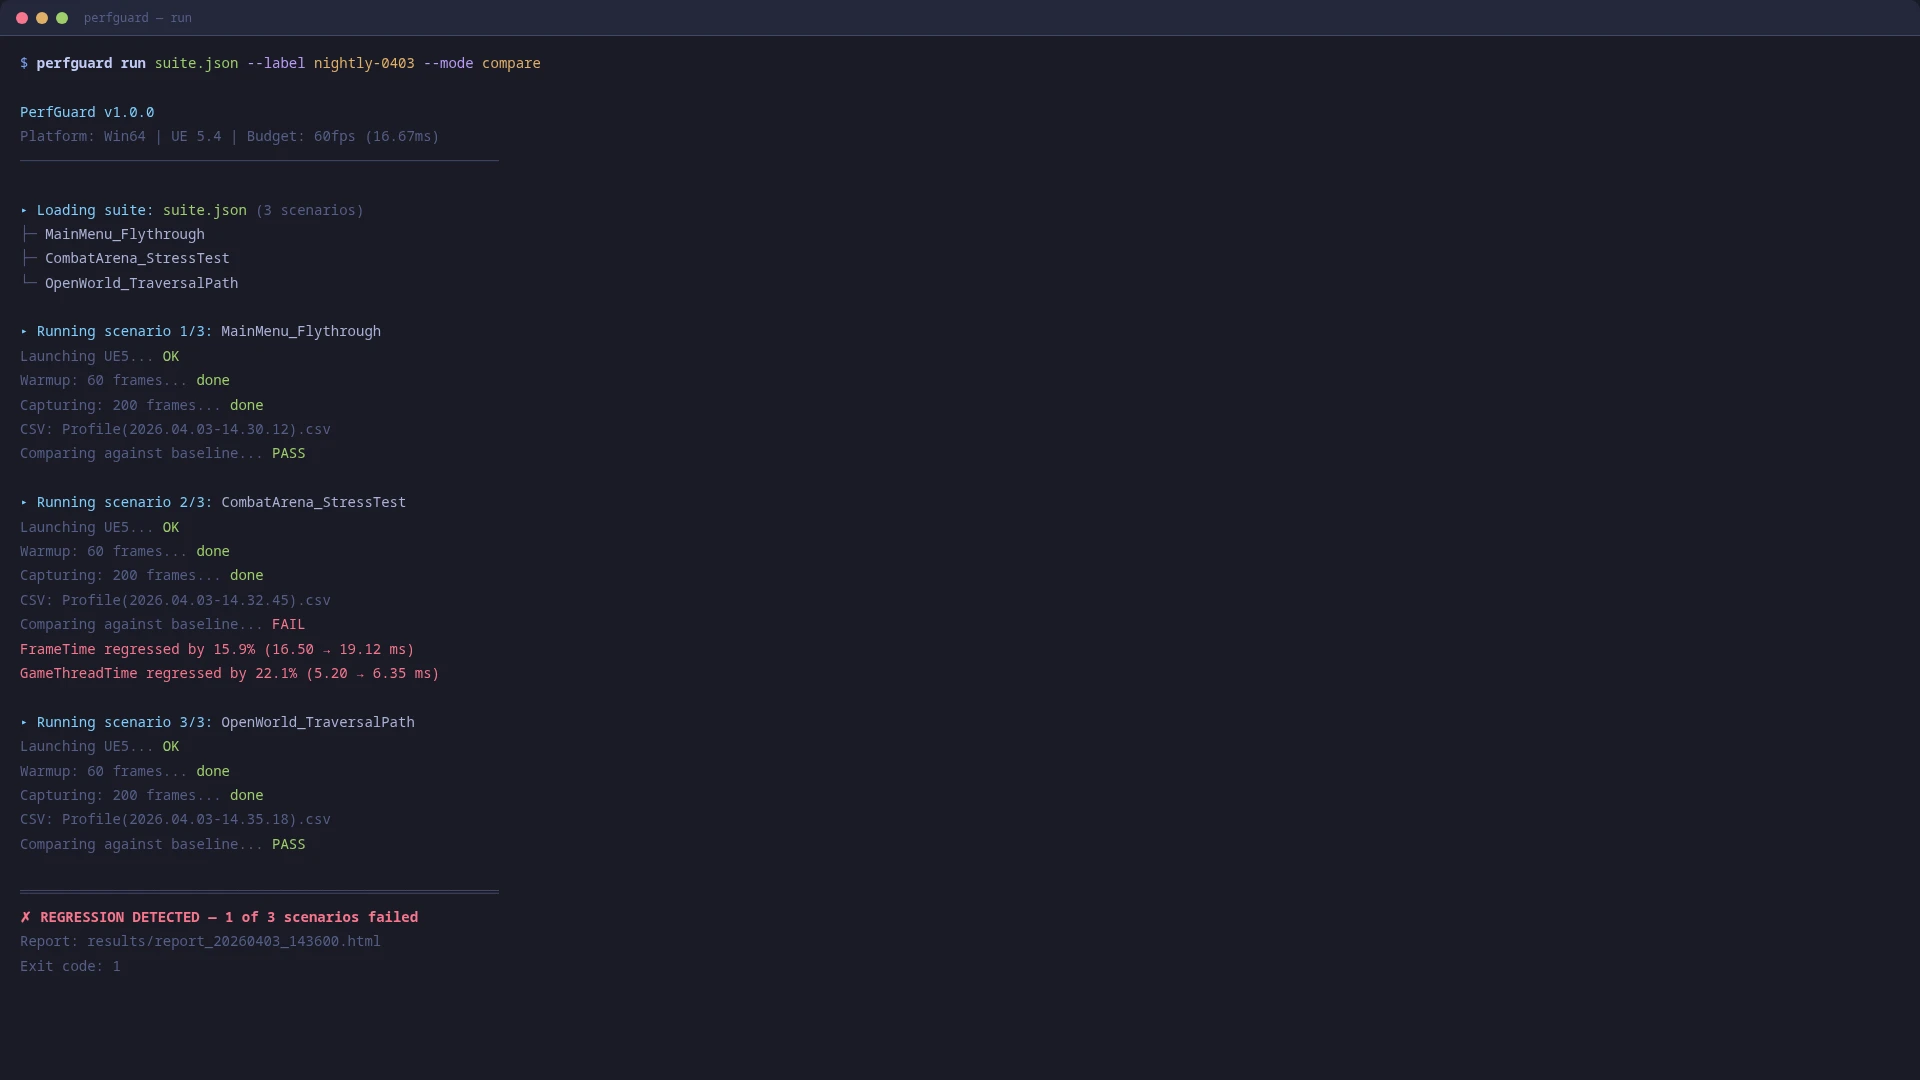
Right-click a map. Capture frame timings in a standalone game process. Compare against a stored baseline. When numbers drift, CI fails — no manual profiling passes on every milestone.
UE 5.4 – 5.8
Win64, Linux & Mac
Source Included
No Online Dependency
Built for UE 5.4–5.8
Win64, Linux & Mac
GitHub Actions, Jenkins, GitLab, BuildGraph
IQR trimming & P95/P99 aggregation
802 CLI tests, 97% coverage
Features
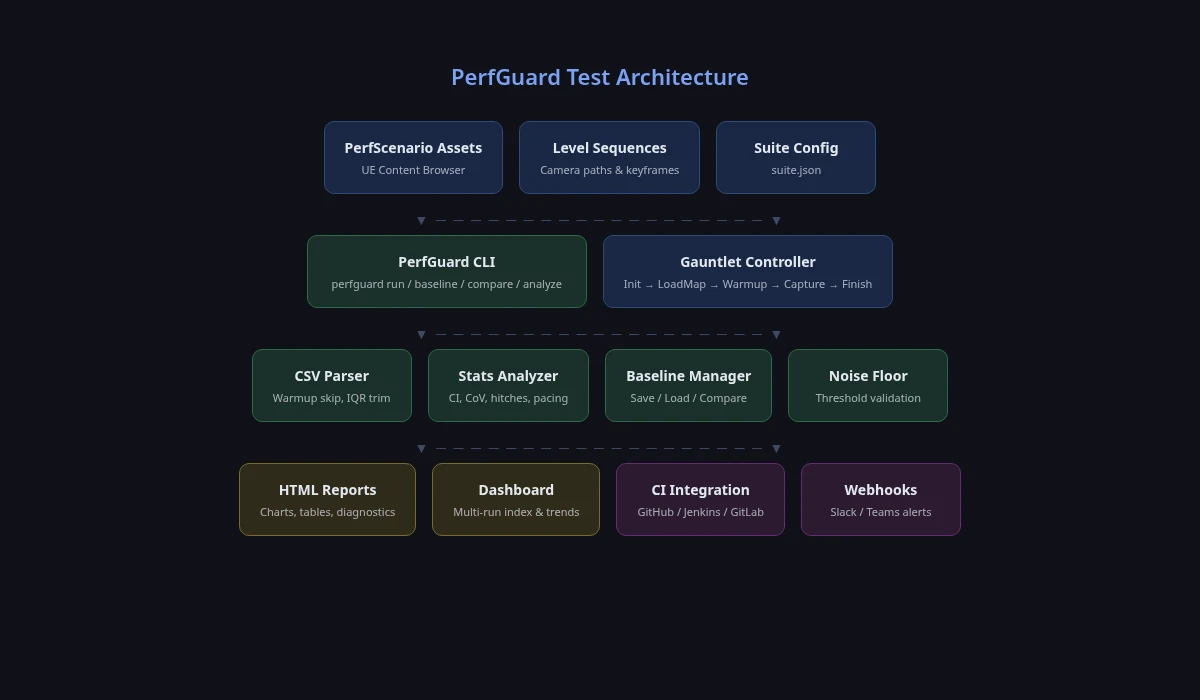
What PerfGuard does
The same scenario you author in the editor is what runs headless in CI. One configuration, two execution paths.
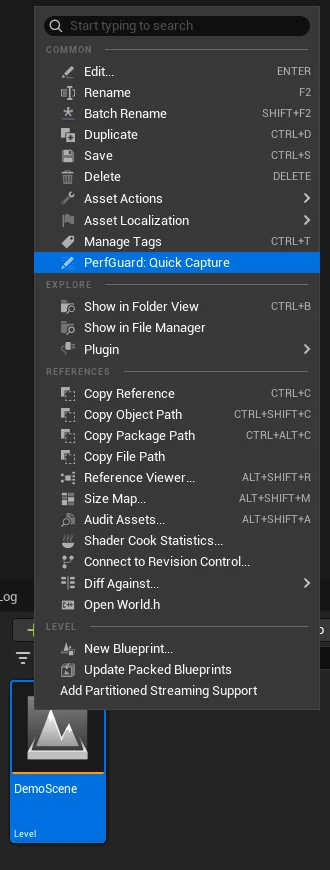
Quick Capture
Right-click any map in the Content Browser and get Frame Time, GPU Time, Draw Calls, and Memory in seconds. No scenario setup, no Level Sequence, no CLI — instant profiling from the editor.
In-Editor Results
View pass/fail results, baseline vs. current values, and deltas directly inside Unreal Editor. No browser or terminal required — open PerfGuard > Results Panel and see everything at a glance.
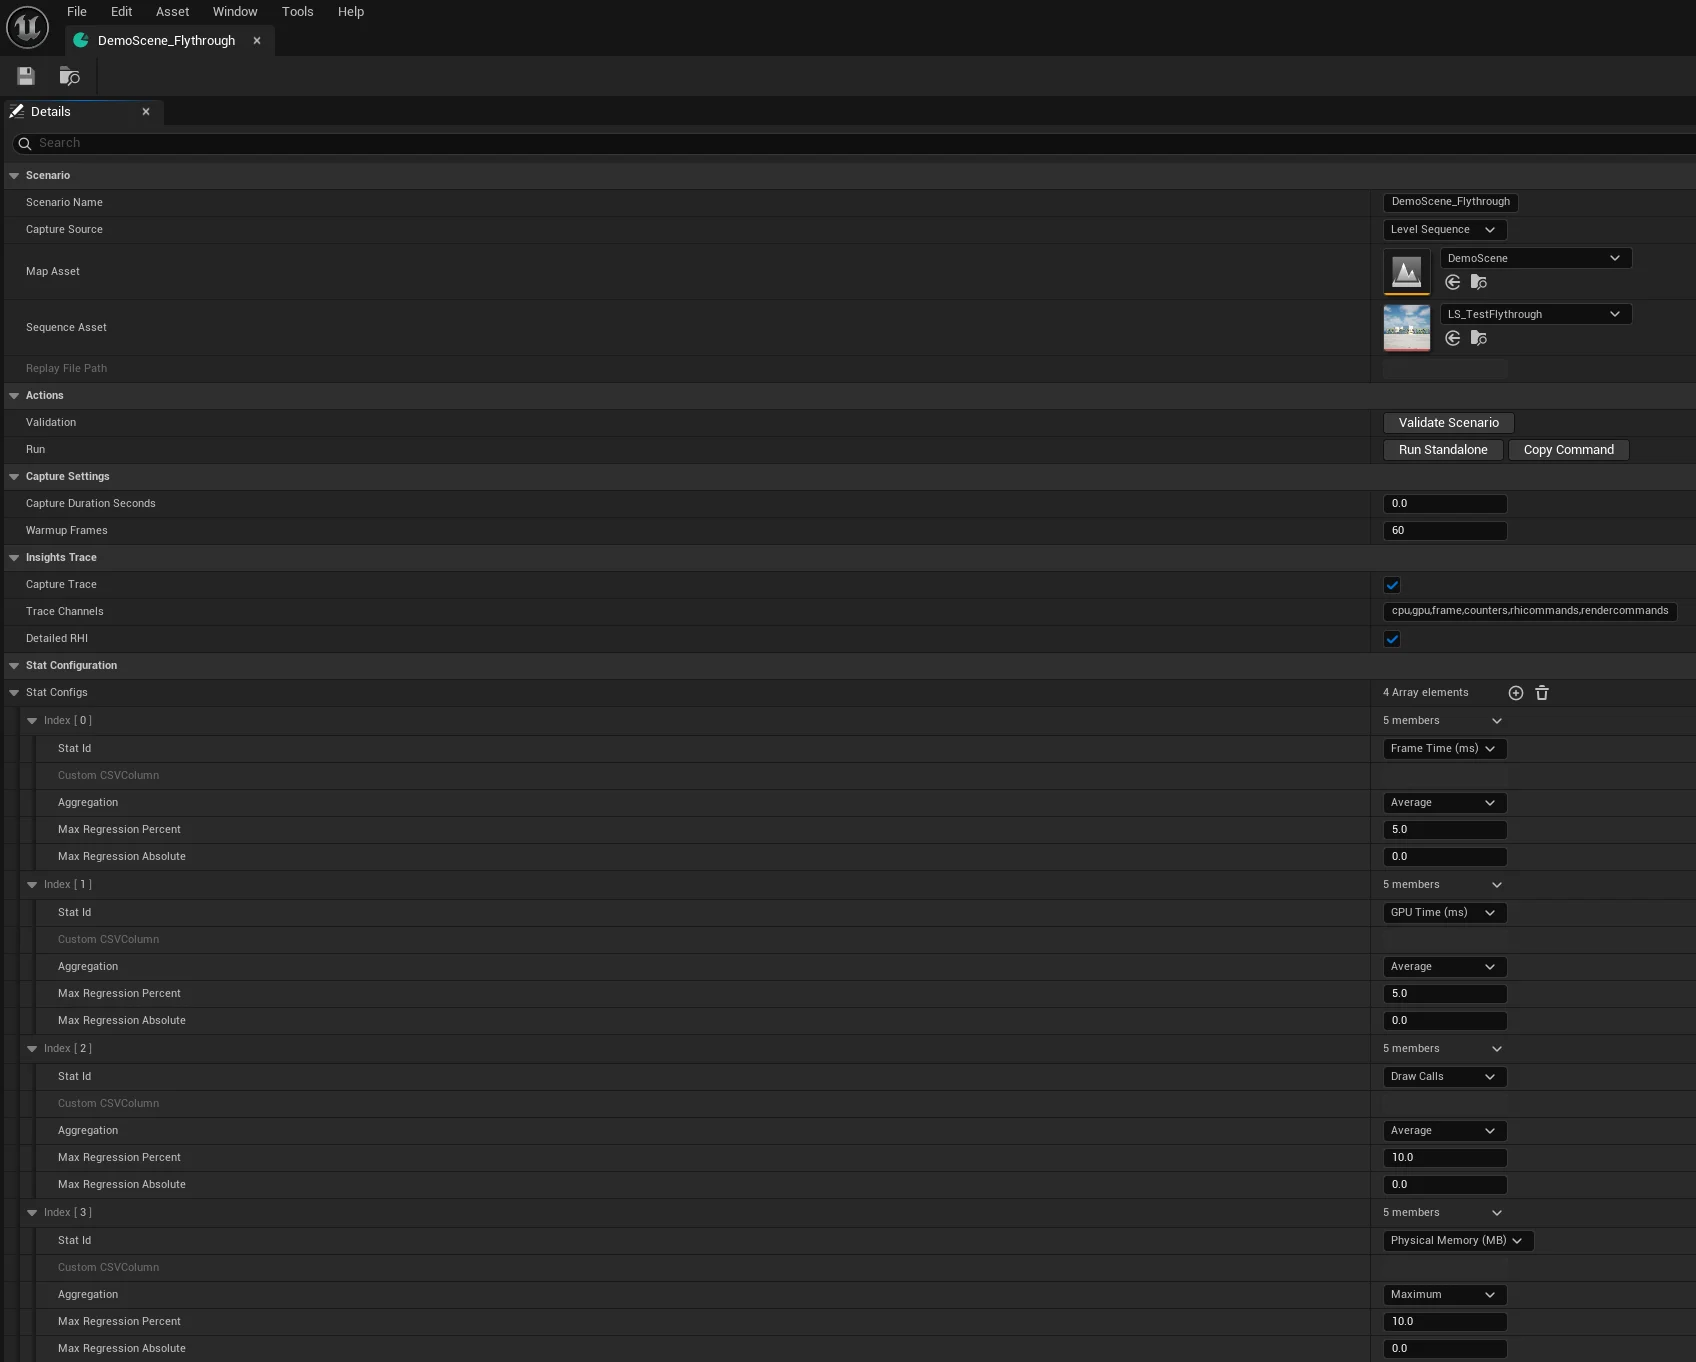
Scenario-Based Testing
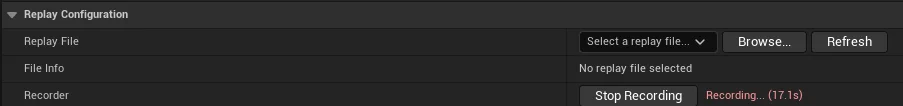
Define test scenarios as UE Data Assets with three capture modes: Level Sequences for deterministic camera flythroughs, Replays for gameplay-driven scenarios, or Duration Only for static scene profiling. Configure warmup, stat selection, and thresholds — all in the editor.
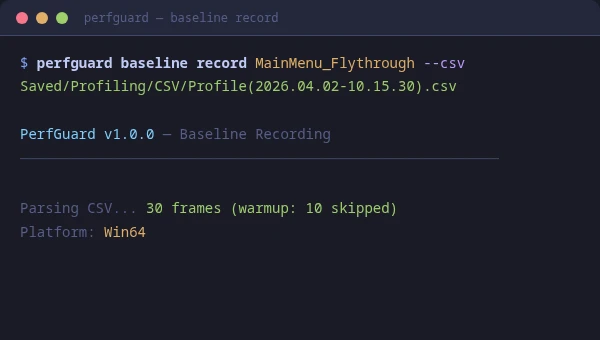
Baseline Management
Record baselines from known-good builds, store as JSON, compare on every PR. Per-platform, per-scenario baselines with export/import for version control.
Rich HTML Reports
Self-contained reports with trend charts, frame time histograms, hitch analysis, executive summaries, and dark mode. Works offline — no external services.
CI/CD Integration
Drop-in configs for GitHub Actions, Jenkins, GitLab CI, and BuildGraph. PR comment bots, exit codes for gating, and JSON output for dashboards.
Hitch Detection & Analysis
Automatic detection of frame spikes with severity classification (mild/moderate/severe), per-hitch bottleneck attribution (GPU/Game Thread/Render Thread), and cluster drill-down.
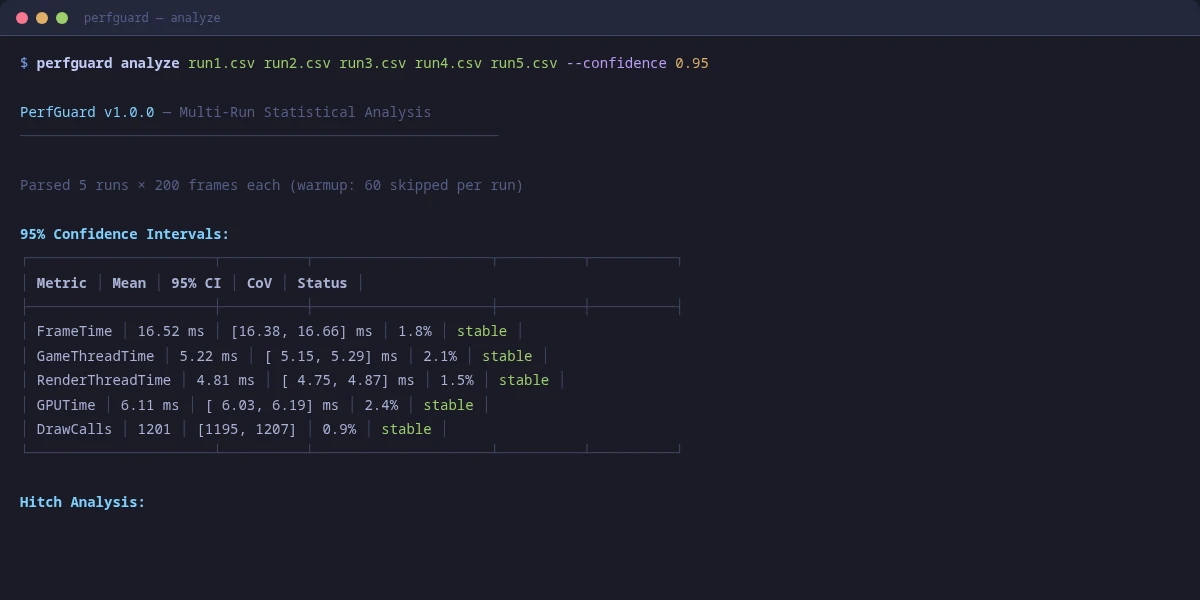
Statistical Analysis
IQR outlier trimming, percentile aggregation (P50/P95/P99), confidence intervals, coefficient of variation detection, and thermal throttle identification.
Webhook Notifications
Get alerted on regressions via Slack, Microsoft Teams, or generic JSON webhooks. Conditional posting — only fires when something regresses.
Frame Budget Presets
Built-in 30fps, 60fps, and VR 90fps budget presets with automatic threshold configuration. One flag to enforce your target frame rate.
Gauntlet Integration
Headless test execution via UE's Gauntlet framework. Full state machine lifecycle (Init → LoadMap → Warmup → Capture → Finish) with timeout protection.
Insights Trace Integration
RHI-level GPU timings via UE Insights traces. Per-pass GPU breakdown charts, draw call detail tables, and an "Open in Insights" launcher for deep investigation.
PR Comment Bots
Automated PR/MR comments with formatted stat tables showing exactly what changed. GitHub Actions and GitLab CI configs included — reviewers see perf impact at a glance.
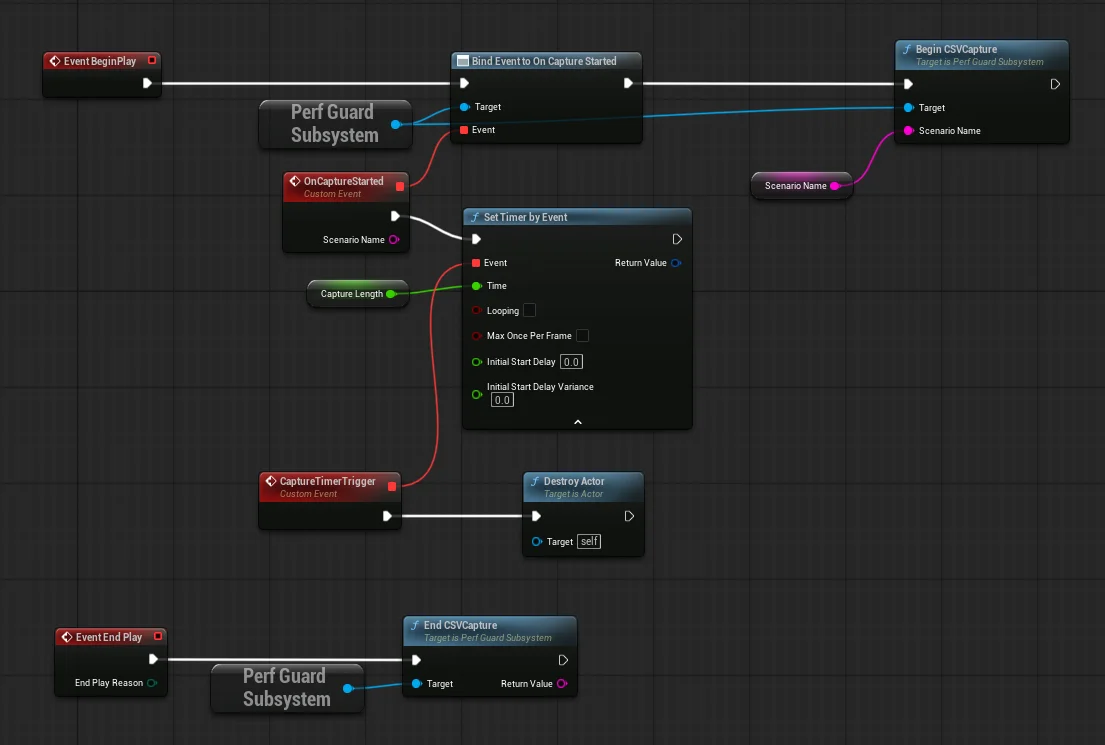
Blueprint API
Full subsystem exposed to Blueprint: CSV capture, sequence/replay playback, baseline I/O, and four multicast delegates. Build custom performance UIs and integrate captures into gameplay events.
PDF Export
Generate print-ready PDFs from HTML reports via headless Chrome. One flag (--pdf), zero external Python dependencies. Share results with stakeholders who prefer documents over dashboards.
Noise Floor Estimation
Per-metric noise floor from multi-run variance or single-run frame data. Warns when regression thresholds are below measurement precision — prevents false positives from hardware noise.
Capture Quality Validation
Engine-level health checks detect GPU time gaps, sequence stalls, warmup instability, and thermal throttling. Configurable warning and failure thresholds with diagnostic cards in reports.
Report Publishing
Check HTML reports into Perforce, Git, Lore (Epic Games' new content-addressed VCS), or a custom command after every run, so QA opens them straight from the workspace. One flag (--commit p4) or a publish block in suite.json; publish failures never fail the build. Every report also records the build's source revision: the git commit, Lore revision, or Perforce changelist it measured.
Why automate
Manual profiling vs. PerfGuard
Milestone-time profiling passes become per-commit checks. Nothing is hidden; everything is reproducible.
✓ Rich HTML reports with charts, hitch analysis, GPU breakdown
Team visibility
One person knows, everyone else guesses
✓ Dashboard, webhooks, and CI artifacts for the whole team
How it works
Capture, compare, gate
Captures run in a standalone -game process so editor overhead doesn't pollute the numbers.
1
Quick Capture
Right-click any map in the Content Browser and select PerfGuard: Quick Capture. A standalone game process captures Frame Time, GPU Time, Draw Calls, and Memory. Your first run records a baseline automatically.
2
Compare & Review
Run Quick Capture again after making changes. PerfGuard compares against the baseline and shows pass/fail results in PerfGuard > Results Panel — all inside the editor.
3
Gate CI
The same scenarios run headless via Gauntlet on the build machine. Non-zero exit code fails the build, and the HTML report is an artifact for the PR.
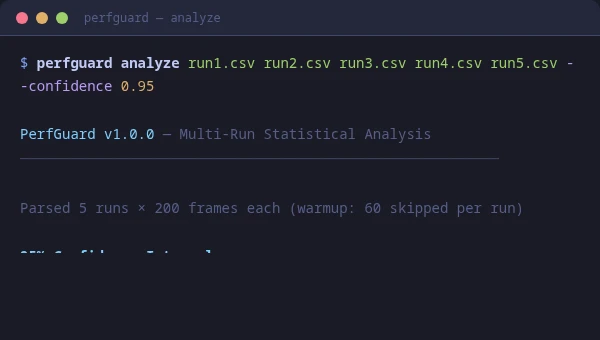
Sample output
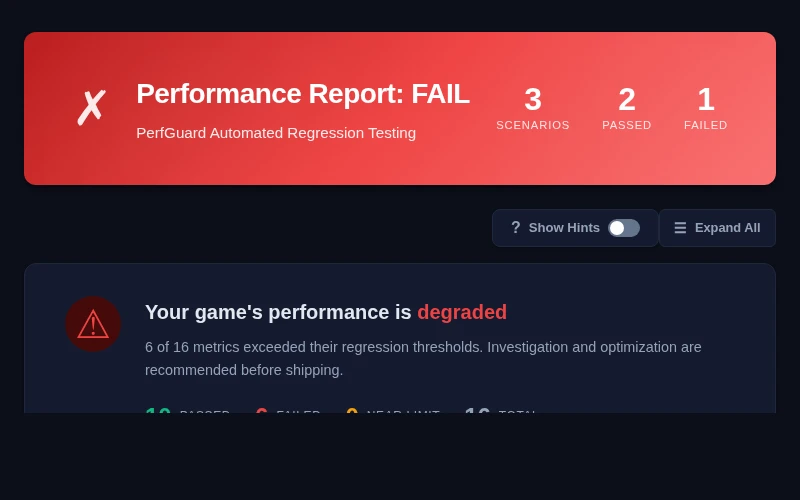
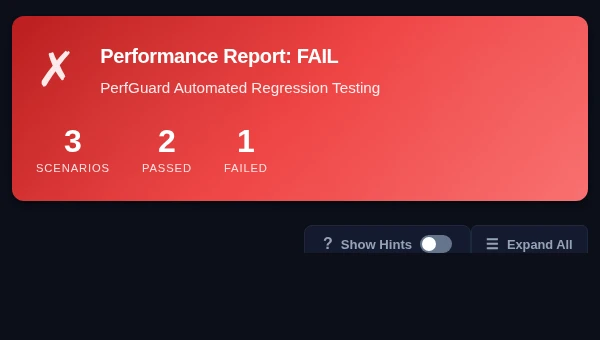
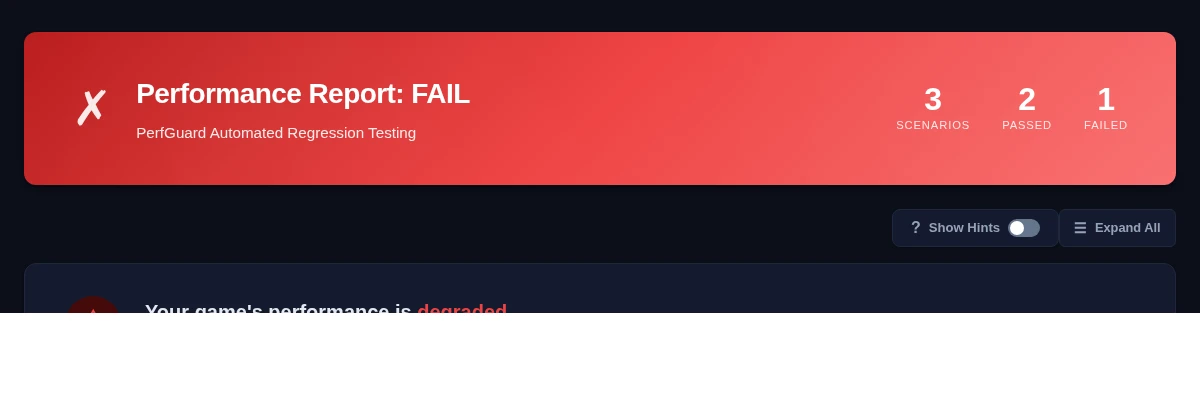
Dashboard and report
A real dashboard and report generated from an actual UE profiling run — click any run for its full report.
# Works with any CI system# Auto-detects GitHub Actions, Jenkins, GitLab, or genericpython Content/Python/perfguard_cli.py \
--suite suite.json \
--mode compare \
--budget 60fps
# Exit codes:# 0 = All checks passed# 1 = Performance regression detected# 2 = Error (bad config, missing files)
Get Started
Plugin Tutorials
Install, author scenarios, set up CI, and read reports — everything you need to ship PerfGuard end-to-end. Looking for general UE5 performance tutorials? Browse the library →
Beginner
Quick Start: Your First Performance Test
Install the plugin, create your first scenario, record a baseline, and run a comparison — all in under 15 minutes.
Author scenarios with Level Sequences, Replays, or Duration Only captures. Configure stat tracking, warmup frames, Insights traces, and organize with tags.
Use PerfGuard entirely from Blueprint — one-button captures, warmup countdowns, live frame time displays, and automated scenario runners without writing C++ or Python.
Check reports into Perforce, Git, Lore, or a custom command after every run — so QA opens them straight from the workspace and the depot history is your audit trail. Includes the suite.json publish block and CI usage.
Subclass the Gauntlet controller for launch-time setup, and package it in a DeveloperTool module so your project still builds in Shipping — with the module layout, the build-config matrix, and how to run captures on a build machine.
Full source at every tier. One-time licenses, no subscriptions.
🎉
Launch Offer — Free for a Limited TimeDownload PerfGuard at no cost while we gather early feedback. Regular pricing will apply once the launch period ends.
PerfGuard ships as one FAB product per UE version — install the build that matches your engine. Currently published for UE 5.4, 5.5, 5.6, 5.7, and 5.8. UE 5.3 is not supported. It uses standard engine APIs (Gauntlet, CSV Profiler, Level Sequences, Asset Registry) and tracks new engine versions as they ship.
What platforms are supported?
▼
PerfGuard supports Win64, Linux, and macOS for editor and runtime use. The CLI tools work on all three platforms. Console and mobile platforms (PlayStation 4/5, Xbox One/Series X, Nintendo Switch, Android, iOS) are also supported for runtime capture and CLI analysis — you run the game on the target device and analyze the CSV output on your desktop.
Do I need Python installed?
▼
Yes, Python 3.11+ is required for the CLI features (baseline comparison, HTML reports, CI). You probably already have one — UE 5.4+ ships CPython 3.11 at Engine/Binaries/ThirdParty/Python3/ for its own scripting plugin, and PerfGuard's editor buttons (Run Standalone, Show Command, post-capture compare) discover that interpreter automatically. PerfGuard itself does not bundle Python — FAB rejects bundled installers and shell scripts in marketplace plugins. If you also want to drive the CLI from a terminal, or run it on a CI machine that doesn't have UE installed, install Python 3.11+ from python.org/downloads on Windows (tick "Add python.exe to PATH") or via your package manager on Mac/Linux (brew install python@3.11, apt install python3.11, etc.).
When should I use Quick Capture vs a PerfScenario?
▼
They share storage and the Results Panel but are different tools for different jobs.
Quick Capture — right-click a map and go. Ten-second capture, default stats, project-wide threshold. No scenario authoring. Filenames are prefixed QuickCapture_<Map> and tagged with an amber badge in the Results Panel. Use it for triage: "did that PR regress perf on this map?"
PerfScenario — an authored data asset you configure in the editor. Configurable duration, warmup, stats, per-stat thresholds, and capture source (Level Sequence for deterministic camera paths, Replay for gameplay, or Duration Only for static scenes). Tagged with a blue badge. Use it for reliable CI gates and noise-controlled measurements. Anything shipping through a pipeline should be a Scenario.
Rule of thumb: Quick Capture is a smoke test, a Scenario is a ship gate. Don't treat a single 10-second Quick Capture as CI signal.
Report content differs too: both generate an HTML report, but Quick Capture disables trace capture to stay fast — so Quick Capture reports have the core charts (timeline, histogram, delta table, percentiles) while Scenario reports add the GPU pass breakdown, per-draw-call RHI detail, and the "Open in Insights" launcher you need to localize why something regressed.
Report section
Quick Capture
Scenario
PASS/FAIL banner, delta table, percentiles
✓
✓
Per-frame timeline, frame histogram, sparklines
✓
✓
Noise-floor assessment, engine health checks
✓
✓
GPU pass breakdown
—
✓ (trace on by default)
Per-draw-call RHI detail
—
✓ (bDetailedRHI on)
▶ Open in Insights launcher
—
✓ (when trace is present)
Capture-source badge
DurationOnly
matches scenario
Replay-specific warnings
n/a
✓ (Replay mode only)
Why do my timestamps show UTC instead of my local time?
▼
PerfGuard stores every timestamp in UTC so baselines and results compare correctly across machines — your Linux CI and your Windows workstation need to agree on what moment a run captures, independent of either side's clock settings.
Display is separate. The Results Panel converts to local time by default. Toggle Project Settings → PerfGuard → UX → Timestamp Display to UTC if you want UTC everywhere (useful for distributed teams). The HTML report does the same client-side: each viewer sees their own local time, with the original UTC available on hover. Opening the report from the editor with the UTC setting adds ?tz=utc to the URL so the report honors your preference.
The Results Panel says "Baseline is N days old" — what should I do?
▼
It's an advisory banner, not a failure. PerfGuard surfaces it so you can tell a legitimate regression apart from baseline drift — if the scene has evolved over 43 days of commits, some of any reported regression is drift, not today's change.
What to do: if today's run is a known-good reference, re-record the baseline. Easiest path — delete the stale file at Saved/PerfGuard/Baselines/<scenario>/<platform>.json and run again (PerfGuard auto-records on the first run per scenario/platform). Or from the CLI: perfguard baseline record <scenario> --auto-csv.
The threshold is configurable under Project Settings → PerfGuard → UX → Stale Baseline Warning Days (default 14). Set to 0 to disable the warning entirely.
The first time I click "Open in Insights", Windows asks me to choose an app. Why?
▼
PerfGuard registers a unrealinsights:// URL scheme in HKCU so clicking the button in the HTML report launches Unreal Insights directly — the same mechanism Discord, Slack, and Zoom use to open their desktop apps from web links.
Windows shows its "How do you want to open this?" dialog the first time the scheme is invoked, so you can confirm what runs. Pick Python (whichever python.exe the plugin discovered on PATH at editor startup) and tick Always use this app. Subsequent clicks launch Insights with no dialog.
If the dialog doesn't appear at all (clicking does nothing), the registration likely didn't run — close the editor fully once and relaunch; registration fires on editor module startup. The button falls back to copying the Insights command to the clipboard if the scheme isn't available (Mac, Linux, or Windows without the HKCU keys).
Does PerfGuard require an internet connection?
▼
No. PerfGuard is fully self-contained and works offline. HTML reports embed Chart.js locally. There is no telemetry, cloud backend, or license server. Webhook notifications are optional and only fire if you configure them.
How does it compare to UE's built-in profiling tools?
▼
UE's profiling tools (Unreal Insights, stat commands, CSV Profiler) are designed for manual investigation. PerfGuard automates the workflow: it captures profiling data via scenarios, compares against baselines, and produces pass/fail verdicts for CI. Think of it as the automation layer on top of UE's existing profiling infrastructure.
Can I use custom stats beyond the 8 built-in ones?
▼
Yes. Any column in UE's CSV profiler output can be tracked. The 8 built-in stats cover the most common metrics, but you can add any custom stat by referencing its CSV column name in your scenario configuration.
Is source code included?
▼
Yes. Full C++ source for all three UE modules (Runtime, Editor, Tests) and all Python CLI tools are included. No obfuscation, no binary-only modules.
What about team/studio licensing?
▼
All tiers include the same features and full source code. During the launch period, Indie and Studio tiers are free. Once regular pricing begins, Indie ($79) covers 1 seat with community support and Studio ($199) covers up to 10 seats with email support and priority bug fixes. Enterprise offers unlimited seats with dedicated support — contact us for custom pricing.
Try it
Free during launch. Install into your project, right-click a map, see the first capture in about a minute.