CI/CD Pipeline Setup
Automate performance regression testing in your build pipeline. PerfGuard includes ready-made configs for GitHub Actions, Jenkins, and GitLab CI.
Prerequisites
Performance testing in CI requires a self-hosted runner with GPU access. Cloud-hosted runners don't have GPUs and can't produce meaningful frame time data. You'll need:
- Unreal Engine 5.4+ installed on the runner
- Python 3.11+ with PerfGuard CLI dependencies installed
- A built project — Gauntlet runs against a cooked or editor build
- Dedicated GPU — consistent GPU hardware for reliable comparisons
- Baselines recorded on the same hardware as the runner
Creating suite.json Configuration
A suite file defines which scenarios to run, their thresholds, and the overall test configuration. Create a suite.json in your project root:
{
  "project": "./YourProject.uproject",
  "ue_root": "/path/to/UnrealEngine",
  "platform": "Win64",
  "warmup": 60,
  "thresholds": { "default_percent": 5.0 },
  "budget": "60fps",
  "scenarios": [
    { "name": "MainMenu_Flythrough" },
    { "name": "GameplayLevel_Overview" },
    { "name": "OpenWorld_Drive" }
  ]
}
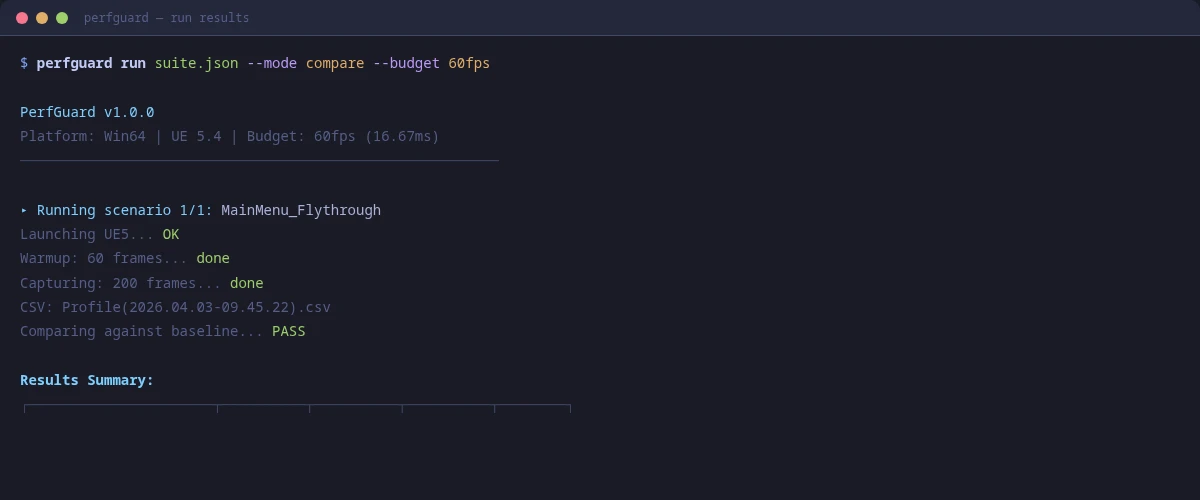
The perfguard run command reads this file and orchestrates the full capture-compare-report cycle for all listed scenarios.
Several optional top-level keys (added in v1.1, each defaulting to prior behavior) tune how the capture process launches:
{
  "controller": "PerfGuardGauntletController",  # Gauntlet controller class to launch (default shown)
  "startup_delay": 0,                          # seconds to pause after engine start, before map load
  "onscreen": false,                         # true runs in a visible window (default is headless -RenderOffScreen)
  "publish": {                               # check the report into version control after the run
    "backend": "p4",
    "message": "PerfGuard CI reports",
    "p4_client": "ci-reports-ws"
  }
}
Each has a CLI equivalent — --controller NAME, --startup-delay SECONDS, --onscreen, and --commit p4|git|lore|command — and CLI flags override the suite file. The publish workflow is covered in full in the Publishing Reports tutorial.
GitHub Actions Setup
Copy the provided workflow file into your repository:
cp Plugins/PerfGuard/Content/Python/ci/github-actions/perfguard.yml \
   .github/workflows/perfguard.yml
copy Plugins\PerfGuard\Content\Python\ci\github-actions\perfguard.yml ^
     .github\workflows\perfguard.yml
The workflow runs on self-hosted runners tagged with gpu. Key sections:
name: PerfGuard Regression Test
on:
  pull_request:
    branches: [main]
  schedule:
    - cron: '0 3 * * *'  # Nightly at 3 AM

jobs:
  perf-test:
    runs-on: [self-hosted, gpu]
    steps:
      - uses: actions/checkout@v4
      - name: Run PerfGuard Suite
        run: |
          python Plugins/PerfGuard/Content/Python/perfguard_cli.py \
            run suite.json --mode compare
      - name: Upload Report
        uses: actions/upload-artifact@v4
        with:
          name: perfguard-report
          path: Saved/PerfGuard/Results/report.html
Jenkins Setup
Copy the Jenkinsfile and configure your Jenkins instance:
cp Plugins/PerfGuard/Content/Python/ci/jenkins/Jenkinsfile ./Jenkinsfile
copy Plugins\PerfGuard\Content\Python\ci\jenkins\Jenkinsfile .\Jenkinsfile
The Jenkinsfile uses the HTML Publisher plugin to serve the generated report directly from the Jenkins build page. Install the plugin via Manage Jenkins → Plugins → HTML Publisher.
pipeline {
    agent { label 'gpu' }
    stages {
        stage('Perf Test') {
            steps {
                sh 'python Content/Python/perfguard_cli.py run suite.json --mode compare'
            }
        }
    }
    post {
        always {
            publishHTML(target: [
                reportDir: 'Saved/PerfGuard/Results',
                reportFiles: 'report.html',
                reportName: 'PerfGuard Report'
            ])
        }
    }
}
GitLab CI Setup
Copy the GitLab CI configuration:
cp Plugins/PerfGuard/Content/Python/ci/gitlab/.gitlab-ci.yml ./.gitlab-ci.yml
copy Plugins\PerfGuard\Content\Python\ci\gitlab\.gitlab-ci.yml .\.gitlab-ci.yml
perf-test:
  stage: test
  tags: [gpu]
  script:
    - python Content/Python/perfguard_cli.py run suite.json --mode compare
  artifacts:
    paths:
      - Saved/PerfGuard/Results/report.html
    when: always
    expire_in: "30 days"
The report is uploaded as a pipeline artifact and available for download directly from the merge request page.
Using perfguard_cli.py
If you don't want to maintain CI-specific configs, the perfguard_cli.py wrapper auto-detects your CI environment and runs the appropriate commands:
# Works in GitHub Actions, Jenkins, GitLab CI, or locally
python Plugins/PerfGuard/Content/Python/perfguard_cli.py \
    run suite.json --mode compare
:: No .sh wrapper on Windows — use the CLI directly
python Plugins\PerfGuard\Content\Python\perfguard_cli.py run suite.json --mode compare
The script detects the CI system from environment variables (GITHUB_ACTIONS, JENKINS_URL, GITLAB_CI), sets up paths, runs the suite, and handles exit codes correctly for each platform.
perfguard_cli.py when you want a quick start that works everywhere. Switch to the platform-specific configs when you need more control over triggers, caching, and artifact handling.
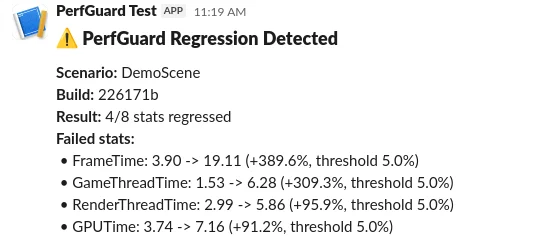
Webhook Notifications (Slack/Teams)
Get notified instantly when a regression is detected. PerfGuard supports Slack, Microsoft Teams, and generic JSON webhooks.
# Slack notification
python3 perfguard_cli.py run suite.json --mode compare \
    --webhook-url https://hooks.slack.com/services/T.../B.../xxx \
    --webhook-format slack

# Microsoft Teams
python3 perfguard_cli.py run suite.json --mode compare \
    --webhook-url https://outlook.office.com/webhook/... \
    --webhook-format teams
:: Slack notification
python perfguard_cli.py run suite.json --mode compare ^
    --webhook-url https://hooks.slack.com/services/T.../B.../xxx ^
    --webhook-format slack

:: Microsoft Teams
python perfguard_cli.py run suite.json --mode compare ^
    --webhook-url https://outlook.office.com/webhook/... ^
    --webhook-format teams
You can also configure webhooks directly in suite.json instead of passing CLI flags:
{
  "webhook": {
    "url": "https://hooks.slack.com/services/T.../B.../xxx",
    "format": "slack",
    "mention": "@oncall"
  }
}
Supported formats: slack, teams, and generic (raw JSON POST to any endpoint).
Understanding Exit Codes
PerfGuard uses standard exit codes that CI systems interpret for pass/fail:
- Exit 0 — All scenarios passed. No regressions detected, all budgets met.
- Exit 1 — Regression detected. One or more stats exceeded thresholds or budget.
- Exit 2 — Error. Something went wrong (missing baseline, CSV parse failure, engine crash).
In CI, exit code 1 fails the build/PR check, which is the core gating mechanism. Exit code 2 also fails but indicates infrastructure problems rather than performance regressions.
continue-on-error: true on the compare step and check ${{ steps.compare.outcome }} to handle regressions without blocking the entire workflow.
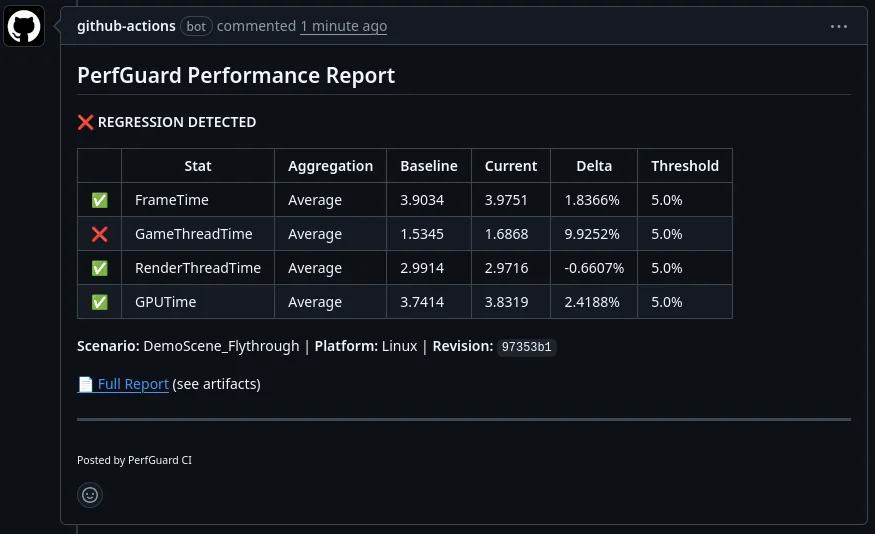
PR Comment Bot Setup
The PR comment bot automatically posts a performance summary as a comment on every pull request. Copy the dedicated workflow:
cp Plugins/PerfGuard/Content/Python/ci/github-actions/pr-comment.yml \
   .github/workflows/perfguard-pr-comment.yml
copy Plugins\PerfGuard\Content\Python\ci\github-actions\pr-comment.yml ^
     .github\workflows\perfguard-pr-comment.yml
The bot posts a markdown table showing each scenario, its pass/fail status, and key stat deltas. It updates the same comment on subsequent pushes rather than creating new ones.
pull-requests: write permission. The default GITHUB_TOKEN has this in most repository configurations, but verify if you're using a restricted token.
Artifact Archival and Report Publishing
Always archive the HTML report and raw results as build artifacts. This creates a historical record you can reference when investigating regressions weeks later.
Key artifacts to archive:
Saved/PerfGuard/Results/report.html— The self-contained HTML reportSaved/PerfGuard/Results/*.json— Raw comparison results (machine-readable)Saved/Profiling/CSV/*.csv— Raw CSV profiler data (optional, large)
Beyond CI artifact storage, PerfGuard can check the report into version control itself — Perforce, Git, Lore, or a custom command — so QA and the rest of the team open it straight from their workspace, with the depot history as an audit trail. Add --commit to the run:
python Content/Python/perfguard_cli.py run suite.json --mode compare \
    --commit p4 --commit-message "PerfGuard CI reports"
Publishing is best-effort: a Perforce, Git, or Lore hiccup prints a warning and never fails the build. For the full workflow — the publish block, choosing exactly what to submit, Git, Lore, and custom commands — see the Publishing Reports to Perforce tutorial.
--json-output results/comparison.json on the compare command to produce machine-readable output alongside the HTML report. This is useful for custom dashboards or trend tracking systems.
perfguard analyze capture1.csv capture2.csv capture3.csv. This computes confidence intervals and flags volatile metrics (CoV > 10%). After accumulating 5+ runs in history, use perfguard baseline auto-tune --apply suite.json to get per-stat threshold recommendations based on observed variance.