Replay System Tutorial
Record real gameplay sessions — combat, AI, physics, streaming — and use them as repeatable performance benchmarks. This tutorial walks you through the complete replay workflow from recording to CI integration.
In This Tutorial
Prerequisites
Before you begin, make sure you have the following:
PerfGuard plugin installed in your UE5 project. If you haven't set it up yet, see the Quick Start tutorial first.
A map with gameplay content — something with AI, physics, or streaming that you want to benchmark. The standalone sample project linked from the FAB product page (under Example Project) ships with the LVL_StackOBot map (built on Epic's Stack-O-Bot sample) you can use.
Basic PIE familiarity — you should know how to start Play-In-Editor and use the console (~ key).
Create a Replay Scenario
Right-click in the Content Browser, then select PerfGuard → Performance Scenario. Name it something descriptive like PS_CombatReplay.
Open the scenario asset and configure these settings:
Scenario Name: CombatReplay (or any name you prefer)
Capture Source: Replay — this tells PerfGuard to play back a recorded demo instead of a Level Sequence
Map Asset: Select your gameplay map
Warmup Frames: 120 — replay scenarios need more warmup for streaming and initialization
Stat Configs: Add FrameTime, GPUTime, GameThreadTime, and DrawCalls
Record a Replay
You have two options for recording gameplay.
Option A: In-Editor Recorder (Recommended)
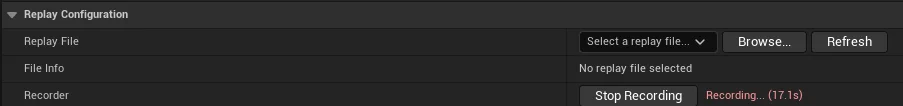
Open your replay scenario in the Details panel. The Replay Configuration section appears automatically when Capture Source is set to Replay. Click Play (PIE) to start Play-In-Editor, then click Start Recording in the Replay Configuration section.
Play through your scenario — fight enemies, trigger physics, run through streaming zones. When you're done, click Stop Recording. The replay file is automatically selected in the dropdown, and the duration is auto-detected.
Option B: Console Commands
If you prefer manual control, start PIE and open the console (~ key):
// Start recording
demorec MyCombatReplay

// Play through your scenario, then stop
demostop
The replay is saved to Saved/Demos/MyCombatReplay.replay. Back in the scenario Details panel, click Refresh in the Replay Configuration dropdown and select your file.
Review the Replay File
After recording, the Replay Configuration section shows metadata for your selected file:
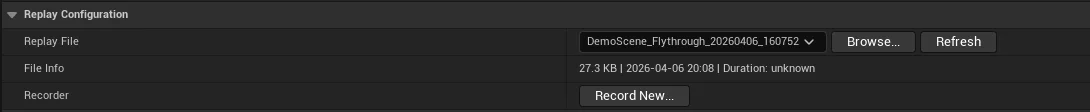
File size — a healthy replay is typically 1–50 MB depending on duration and complexity.
Last modified date — replays older than 30 days may not be compatible with engine updates.
Duration — auto-detected from the replay header when available.
Click the Validate Scenario button in the Actions section to run replay-specific checks: replay file exists and is non-empty, capture duration is set, warmup frames are adequate (120+ recommended), and determinism settings are configured.
Run the Capture
Click Run Standalone in the Actions section of the scenario Details panel. This launches a separate process (not PIE) that loads the map, starts replay playback, warms up for the configured number of frames, captures CSV performance data, and saves results to Saved/PerfGuard/Results/.
You can also run from the CLI with the single-line wrapper:
perfguard run-scenario CombatReplay --project MyProject.uproject
This invokes the same capture pipeline as the Run Standalone button — Gauntlet launch, warmup, CSV capture, baseline record or compare, and report generation in one step.
For power users, the underlying Gauntlet invocation:
UnrealEditor MyProject.uproject -game \
    -gauntlet=PerfGuardGauntletController \
    -scenario=CombatReplay \
    -csvprofile -RenderOffScreen -unattended -log
UnrealEditor.exe MyProject.uproject -game ^
    -gauntlet=PerfGuardGauntletController ^
    -scenario=CombatReplay ^
    -csvprofile -RenderOffScreen -unattended -log
Record a Baseline and Compare
perfguard run-scenario handles the baseline lifecycle automatically: the first run records the baseline, and every subsequent run compares against it. No separate record or compare step needed:
perfguard run-scenario CombatReplay --project MyProject.uproject
After making gameplay or rendering changes, run the same command again — PerfGuard detects that a baseline exists and compares automatically:
perfguard run-scenario CombatReplay --project MyProject.uproject
perfguard analyze to get confidence intervals before drawing conclusions about regressions.
Read the Replay-Aware Report
Generate the HTML report from your results:
perfguard report Saved/PerfGuard/Results/
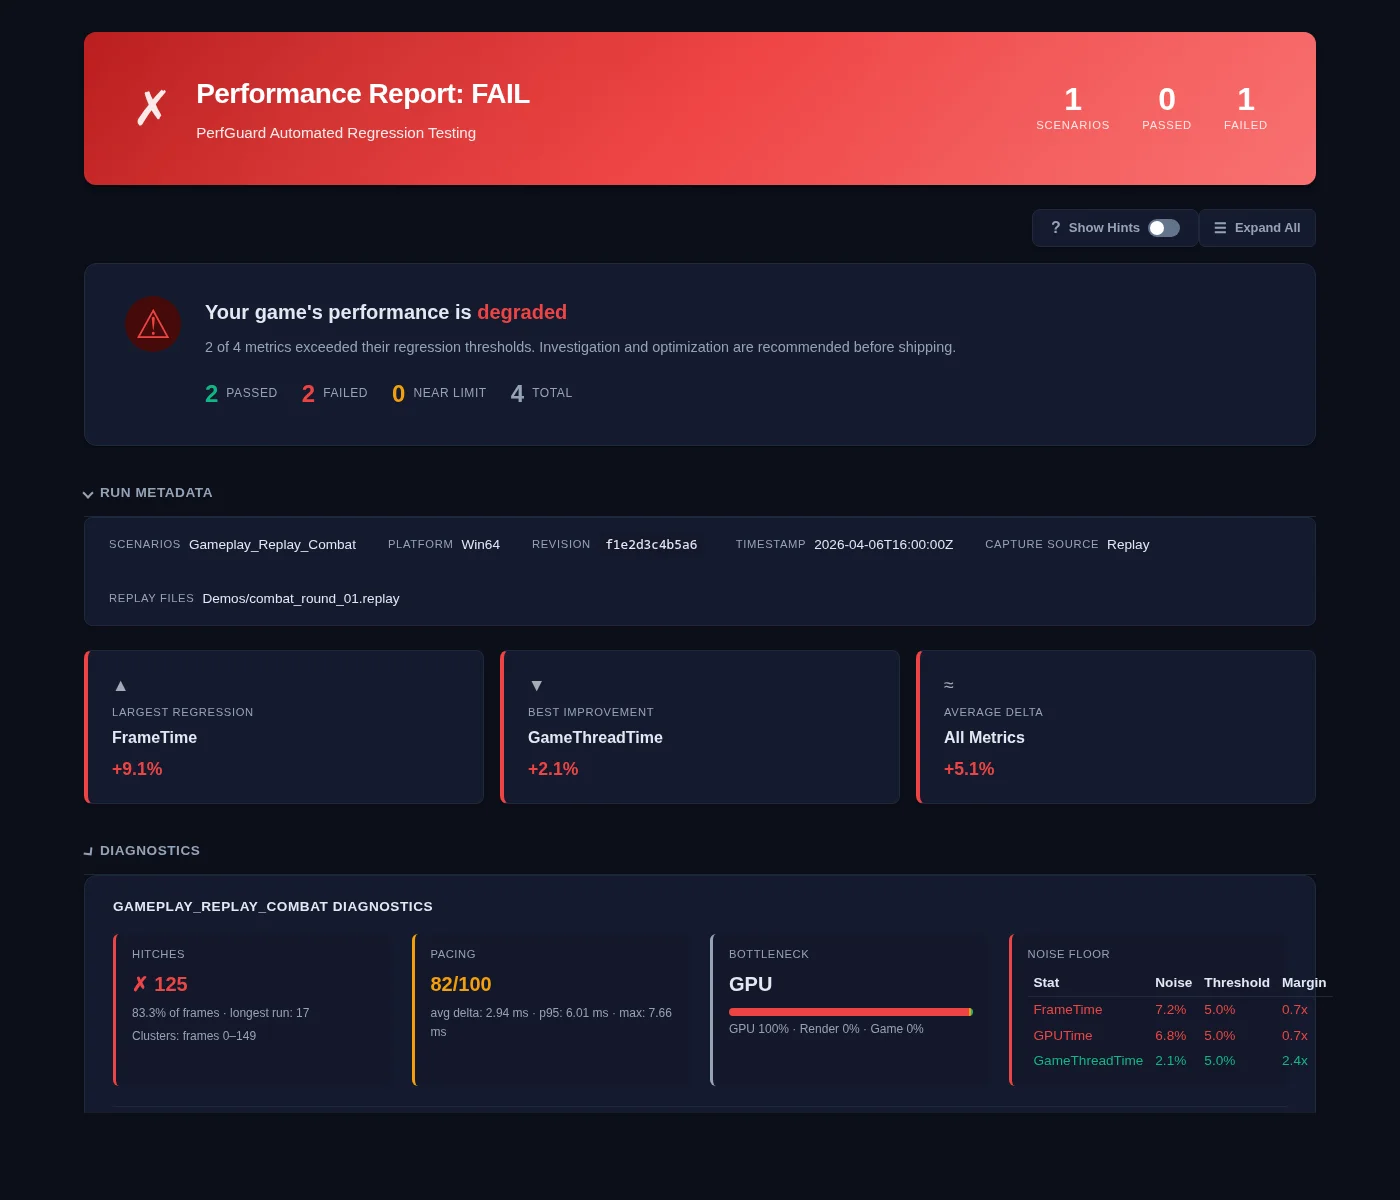
The HTML report includes several replay-specific features:
Capture Source Badge — an orange "Replay" badge next to the scenario name, so you can instantly distinguish replay captures from Level Sequence captures.
Single-Run Warning — if you only ran once, the report recommends running 3+ times for reliable regression detection.
High CoV Warning — if the coefficient of variation exceeds 5%, the report flags it and explains that this is expected with replay captures due to non-deterministic physics, AI, and streaming.
Replay Metadata — the report's metadata section shows the replay file name and capture source for traceability.
Understanding Replay Variance
Replay captures have inherent variance that Level Sequence captures do not. Understanding the sources helps you set appropriate thresholds and interpret results correctly.
| Source | Cause | Mitigation |
|---|---|---|
| Physics | Floating-point non-determinism across runs | Use wider thresholds (8–15%) or multi-run analysis |
| AI | Behavior tree randomization and decision variance | Seed RNGs for test scenarios, or accept variance |
| Streaming | Async loading timing varies between runs | Higher warmup frames (120–180) |
| Network | Replay doesn't capture all client-side effects | Use local replays only |
perfguard analyze for statistical confidence. Set warmup to 120+ frames for streaming-heavy maps. Use explicit duration — don't rely on auto-detection for CI. Enable fixed frame rate in Project Settings for more deterministic results. Use wider thresholds (8–15%) for physics-heavy replays.
Blueprint API for Replays
The replay system is fully exposed to Blueprint via the PerfGuard Subsystem (access via Get Game Instance → Get Subsystem → PerfGuard Subsystem). These functions let you build custom replay workflows entirely in Blueprint:
StartReplayPlayback(ReplayFilePath, World)   // Start replay playback
StopReplayPlayback()                            // Stop replay playback
IsReplayPlaying()                               // Check if a replay is currently playing
GetReplayDuration(ReplayFilePath)              // Get duration in seconds
GetDefaultReplayDir()                           // Get configured replay directory path
CI Integration
Replay scenarios work with all CI systems just like Level Sequence scenarios. The key difference is using wider thresholds to account for replay variance.
In your suite.json, replay scenarios look like any other — the scenario asset itself defines the capture source:
{
  "scenarios": [
    {
      "name": "CombatReplay",
      "thresholds": {
        "FrameTime": {"max_regression_percent": 10.0},
        "GPUTime": {"max_regression_percent": 10.0}
      }
    }
  ]
}
Note the wider thresholds (10% vs the typical 5%) to account for replay variance.
Your CI workflow runs the same command regardless of capture source:
- name: Run replay benchmark
  run: |
    perfguard run suite.json --mode compare --budget 30fps
For more details on CI pipeline configuration including Jenkins, GitLab, and BuildGraph, see the CI Setup tutorial.