Authoring Performance Scenarios
PerfScenario assets are the core of PerfGuard. Learn how to create camera paths, select the right stats, configure warmup, and organize your test suite.
Understanding PerfScenario Assets
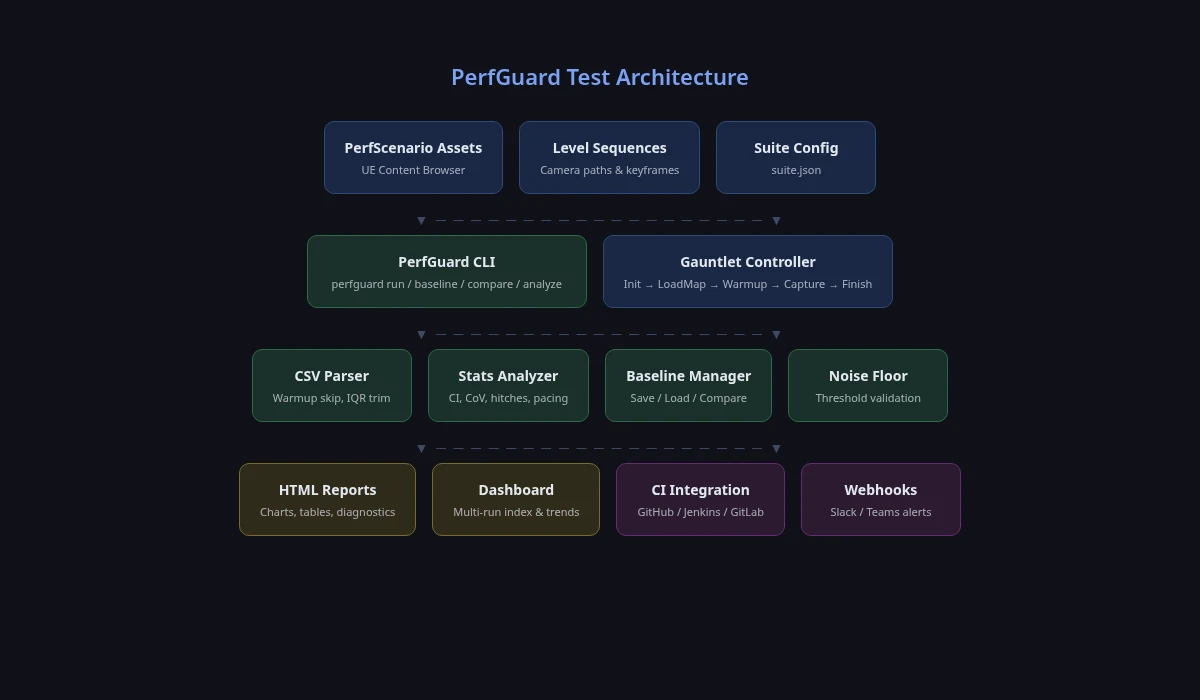
A UPerfScenario is a UPrimaryDataAsset that packages everything PerfGuard needs to run a single performance test: which map to load, which Level Sequence to play, which stats to record, and how to handle warmup.
The Gauntlet controller uses the Asset Registry to discover scenarios by name at runtime, so they can live anywhere in your content hierarchy. One scenario = one test. A typical project has 3–10 scenarios covering different maps or camera angles.
Creating a Level Sequence Camera Path
Every scenario needs a Level Sequence that drives a CineCamera Actor along a deterministic path. This is what makes your tests repeatable — the same pixels are rendered every run.
In the editor, with your test map open:
- Top toolbar → Cinematics → Add Level Sequence. Name and save it (e.g.,
LS_MainMenu_Flythrough). - In Sequencer, set the playback range. Right-click the timeline → Edit Playback Range, or drag the red end-marker, to ~30 seconds. Aim for 10–30s total: shorter runs have noisy averages, longer ones waste CI time.
- Click + Track → Camera Cut Track. This is the track that switches the viewport to render through your camera during playback — without it, the sequence plays but the viewport doesn't follow.
- Click + Track → Actor To Sequencer → Cine Camera Actor. UE spawns one in the level and adds a track for it.
- On the Camera Cut Track, click its + button and pick the Cine Camera you just added. (Or drag the Cine Camera track onto the Camera Cut Track.)
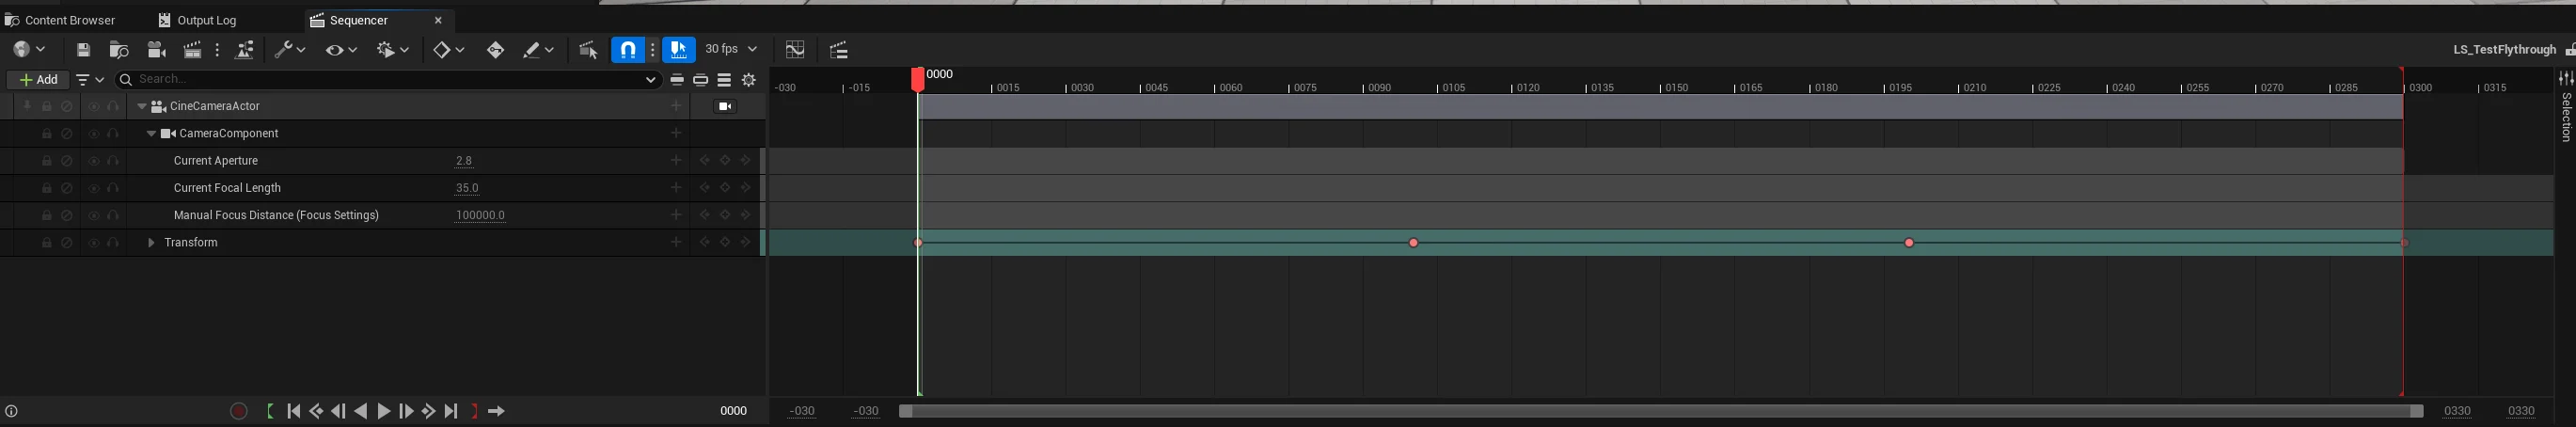
- Right-click the Cine Camera in the viewport → Pilot. WASD now flies the camera directly. With the playhead at frame 0, fly to your start position and click the ● key icon on the Cine Camera's Transform track to keyframe it.
- Drag the playhead forward (e.g., +5s), fly to the next vantage, keyframe again. Repeat until you've covered the heaviest views. Right-click the camera → Stop Piloting when done.
- Ctrl+S to save, then press play in Sequencer to verify the path is smooth.
CaptureSource to Replay in your scenario asset, record a replay via the in-editor UI or demorec/demostop console commands, and PerfGuard will play it back during capture. See the Replay Tutorial for a full walkthrough.
Configuring Scenario Properties
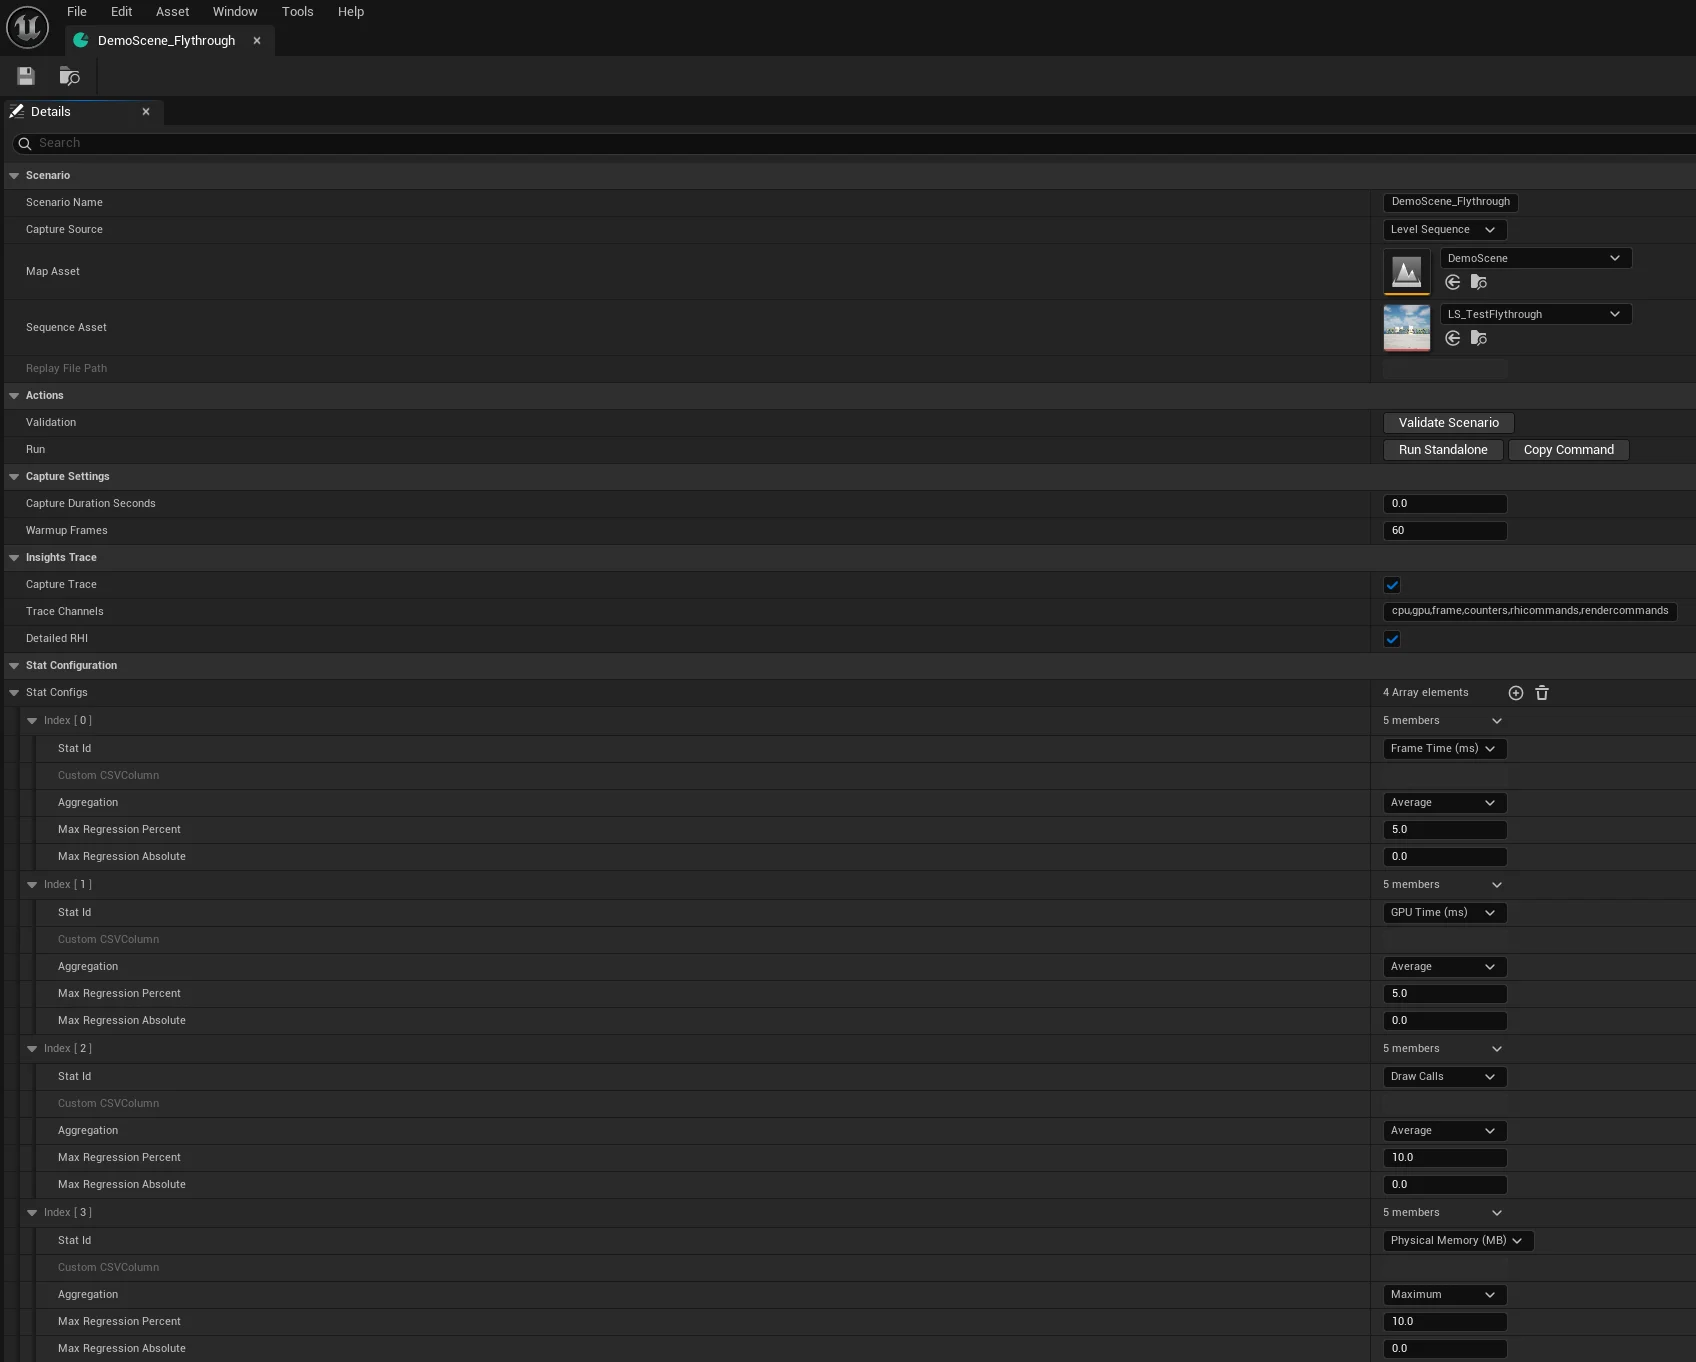
Open your PerfScenario asset and set these core properties in the Details panel:
- Scenario Name — A unique identifier used by the CLI (e.g.,
MainMenu_Flythrough) - Capture Source — Choose between Level Sequence (deterministic camera flythroughs), Replay (gameplay-driven scenarios with AI/physics), or Duration Only (static scene profiling from a fixed viewpoint)
- Map — Soft reference to the level asset to load
- Level Sequence — Soft reference to the camera sequence to play (Level Sequence mode)
- Replay File Path — Path to a
.replayfile inSaved/Demos/(Replay mode) - Capture Duration — How long to capture in seconds; 0 = use sequence/replay length
- bCaptureTrace — Record an Insights trace alongside CSV (default: true)
- bPauseSequenceDuringWarmup — Hold the Level Sequence paused on frame 0 (cinematic camera bound) through warmup, then start it when capture begins. Default off; useful on streaming-heavy maps with long cold-start warmups (v1.1+)
Selecting Stats to Track
The Stat Configs array determines which CSV profiler columns PerfGuard monitors. Common choices:
- FrameTime — Total frame time in ms (the primary metric)
- GameThreadTime — CPU game thread cost
- RenderThreadTime — CPU render thread cost
- GPUTime — GPU frame cost
- DrawCalls — Number of draw calls per frame
- TrianglesDrawn — Triangle count per frame
You can track any column present in the CSV profiler output. Start with the defaults and add more as you identify bottlenecks.
Setting Warmup Frames
The first frames of any capture are polluted by shader compilation, texture streaming, and level loading hitches. The Warmup Frames setting tells PerfGuard how many initial frames to discard before measuring.
A typical value is 60 frames (about 1 second at 60fps). If your scene has heavy streaming (large open worlds), increase to 120–180.
perfguard run-scenario MyScenario --project path/to/MyProject.uproject
The warmup frame count is read from the scenario asset. run-scenario runs the full capture, auto-records the baseline on the first run, and compares on subsequent runs — no extra steps required.
bPauseSequenceDuringWarmup (v1.1+) to hold the sequence paused on frame 0 with the cinematic camera bound, then play it the moment capture starts.
Using Tags for Organization
PerfScenario assets support tags for grouping and filtering. Use them to categorize tests by area, priority, or purpose:
gpu-heavy— Scenes that stress the GPUcpu-bound— Game thread bottleneck testssmoke— Fast sanity checks for every PRnightly— Comprehensive tests for nightly buildsmarketplace-demo— Scenarios for demo scenes
Tags can be used in suite configuration files to run subsets of your test suite in different CI contexts.
Naming Conventions and Best Practices
Adopt a consistent naming scheme so scenarios are self-documenting:
# Pattern: PS_{MapName}_{ViewDescription}
PS_MainMenu_FullRotation
PS_CityLevel_StreetFlythrough
PS_Arena_CombatOverview
PS_OpenWorld_LongDrive
- Prefix with
PS_so scenarios are easy to find in the Content Browser - Include the map name for immediate context
- Describe what the camera does, not the test purpose
- Store all scenarios under
Content/PerfGuard/Scenarios/
Testing Scenarios in the Editor
Before running headless Gauntlet captures, verify your scenario works in the editor. Open the PerfScenario asset and use the Preview functionality to play the sequence in-editor and confirm the camera path is correct.
Check for:
- Camera clips through geometry
- Sequence length is appropriate (10–30 seconds)
- The heaviest views are covered by the camera path
- No dependency on runtime gameplay state
Editor Integration
PerfScenario assets have built-in editor tooling to speed up your workflow:
- Validate button — In the Details panel, click Validate to check for missing map or level sequence references before running a capture
- Run button — Launch a Gauntlet capture directly from the editor without switching to the command line
- Context menu — Right-click scenario assets in the Content Browser for quick actions
Insights Trace Capture
PerfGuard can record Unreal Insights traces alongside CSV profiler data, giving you GPU pass timings, RHI commands, and per-draw-call detail for deep investigation.
Trace capture is on by default (bCaptureTrace = true) on every new PerfScenario. Trace data appears in the HTML report as GPU pass breakdown charts. Set bCaptureTrace to false on individual scenarios — or pass --no-trace to perfguard run — if you want lighter, faster captures.
# Via CLI flag
perfguard run suite.json --no-trace

# Or set bCaptureTrace = false on the scenario asset