Quick Start: Your First Performance Test
Install the plugin, create a scenario, record a baseline, compare against it. About 15 minutes end to end.
Install PerfGuard Plugin
PerfGuard can be installed from the FAB marketplace or by copying the plugin directly into your project. For manual installation, clone or extract the plugin into your project's Plugins/ directory.
# Option A: Copy plugin folder
cp -r PerfGuard/ YourProject/Plugins/PerfGuard/

# Option B: Symlink (useful during development)
ln -s /path/to/PerfGuard YourProject/Plugins/PerfGuard
:: Option A: Copy plugin folder
xcopy /E /I PerfGuard\ YourProject\Plugins\PerfGuard\

:: Option B: Symlink (useful during development)
mklink /D "YourProject\Plugins\PerfGuard" "C:\path\to\PerfGuard"
After copying, regenerate your project files so UnrealBuildTool picks up the new plugin module.
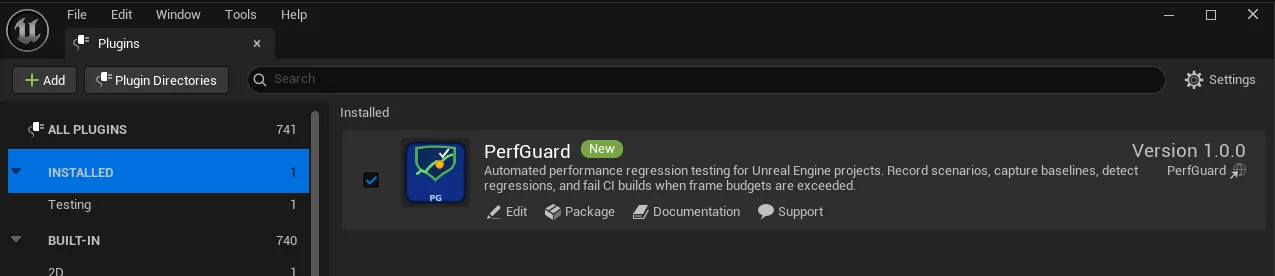
Enable the Plugin in UE Editor
Open your project in Unreal Editor and navigate to Edit → Plugins. Search for "PerfGuard" and enable it. The editor will prompt you to restart — go ahead and restart.
Saved/ directory: baselines in Saved/PerfGuard/Baselines/, results and HTML reports in Saved/PerfGuard/Results/, and run history in Saved/PerfGuard/History/. These paths can be overridden per-suite in suite.json (using baselines_dir, results_dir, history_dir, report_output) or via CLI flags like --baselines-dir and --output.
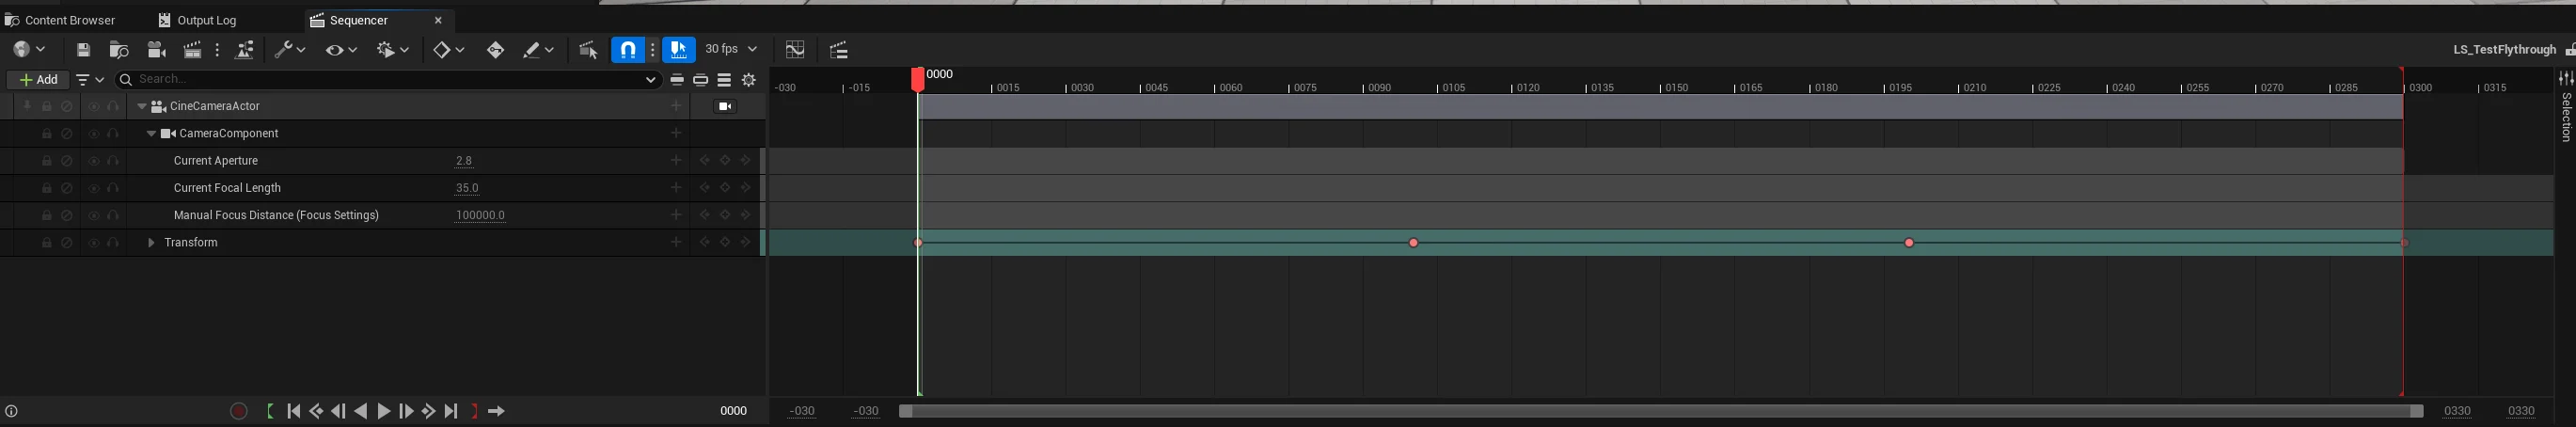
Create a Level Sequence Camera Flythrough
Performance scenarios use Level Sequences to drive a deterministic camera path through your scene. This ensures you're testing the same visual workload every time.
In the editor, go to Cinematics → Add Level Sequence, then add a CineCamera Actor and keyframe a path that covers the heaviest areas of your map.
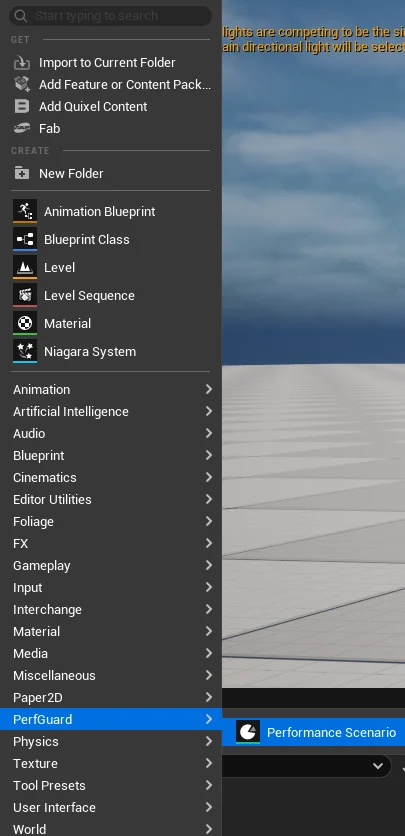
Create a PerfScenario Asset
Right-click in the Content Browser and select PerfGuard → Performance Scenario. This creates a new UPerfScenario data asset that tells PerfGuard what map to load, which sequence to play, and which stats to capture.
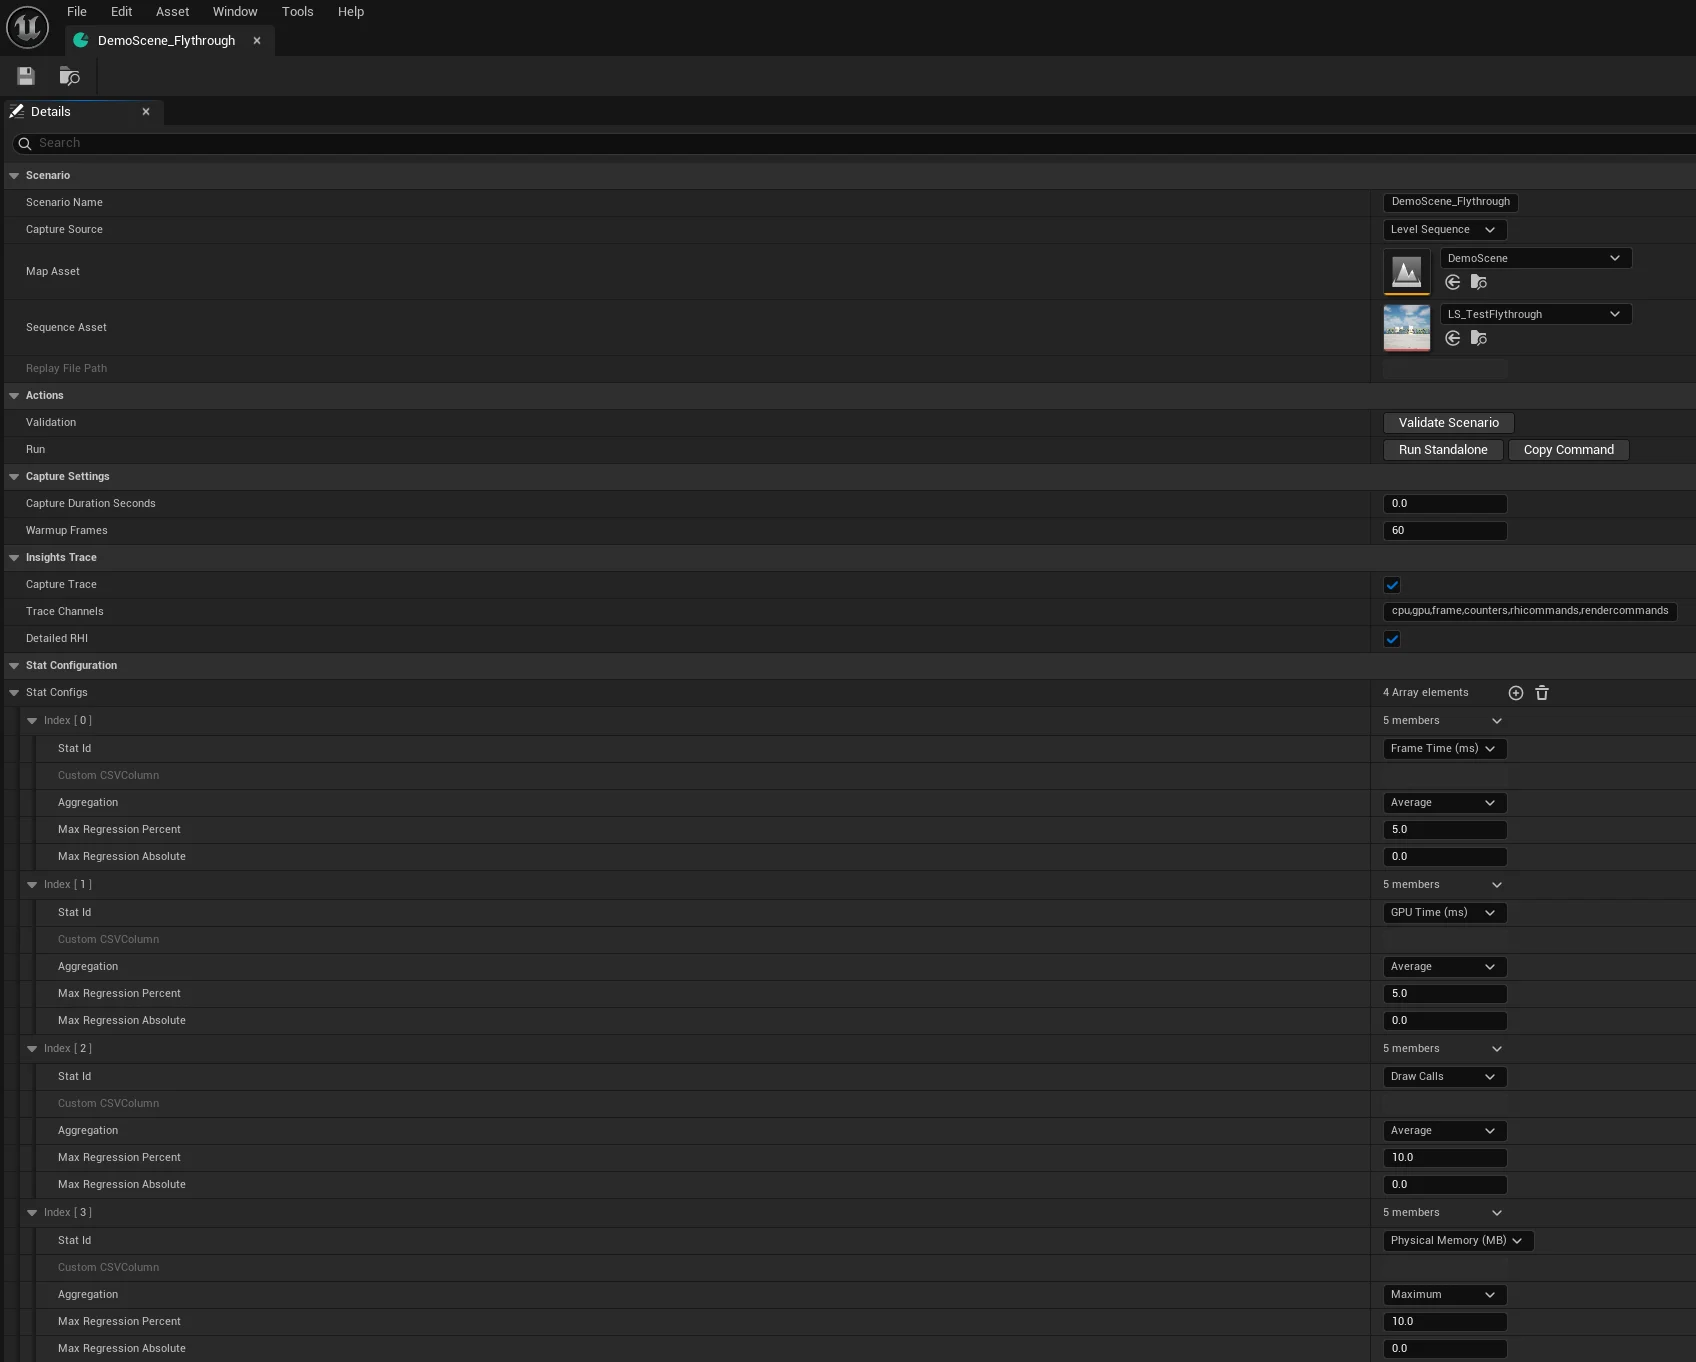
Configure the Scenario
Open your new PerfScenario asset and fill in the core properties:
- Map — the level to load for this test
- Level Sequence — the camera flythrough you created
- Stat Configs — which CSV profiler columns to monitor (FrameTime, GPUTime, DrawCalls, etc.)
- Warmup Frames — frames to skip at the start (shader compilation, asset streaming)
Install the Python CLI
PerfGuard's analysis tooling runs as a Python CLI. You need Python 3.11 or later.
cd Plugins/PerfGuard/Content/Python

# Verify the CLI is working
python3 perfguard_cli.py --help
cd Plugins\PerfGuard\Content\Python

:: Verify the CLI is working
python perfguard_cli.py --help
python --version to verify.
You can also invoke the CLI by full path from your project root instead of cd-ing into the plugin:
python Content/Python/perfguard_cli.py <command>(Linux/Mac)python Content\Python\perfguard_cli.py <command>(Windows)
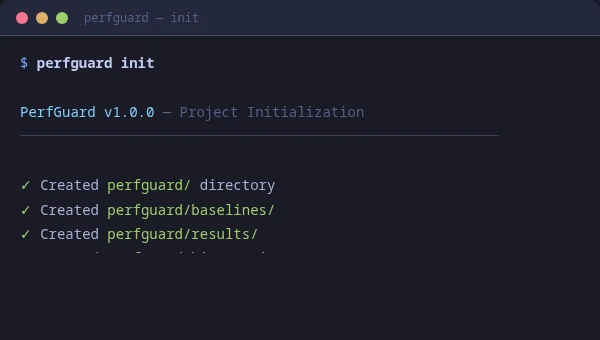
To scaffold starter configuration files (suite config, baseline directory, CI workflow template), run:
perfguard initRun Gauntlet Capture
Launch the engine in headless game mode with the Gauntlet controller. This loads your scenario, plays the sequence, captures CSV profiler data, and exits automatically.
UnrealEditor YourProject.uproject \
    -game \
    -gauntlet=PerfGuardGauntletController \
    -scenario=MyScenario \
    -csvprofile \
    -trace=cpu,gpu,frame,counters,rhicommands,rendercommands \
    -RenderOffScreen \
    -unattended \
    -log
UnrealEditor-Cmd.exe YourProject.uproject ^
    -game ^
    -gauntlet=PerfGuardGauntletController ^
    -scenario=MyScenario ^
    -csvprofile ^
    -trace=cpu,gpu,frame,counters,rhicommands,rendercommands ^
    -RenderOffScreen ^
    -unattended ^
    -log
The CSV output lands in Saved/Profiling/CSV/. The controller logs progress under the LogPerfGuard category.
-game flag is required. Gauntlet controllers only initialize in game mode, not editor mode. Without it, the controller silently won't start.
Record a Baseline
Once you have CSV data from a known-good build, record it as your baseline. This is the reference point all future runs will be compared against.
python3 perfguard_cli.py baseline record MyScenario \
    --csv Saved/Profiling/CSV/Profile(20260115_103000).csv \
    --platform Win64 \
    --warmup 60
python perfguard_cli.py baseline record MyScenario ^
    --csv Saved\Profiling\CSV\Profile(20260115_103000).csv ^
    --platform Win64 ^
    --warmup 60
This parses the CSV, trims warmup frames, removes outliers, and saves a .json baseline file to the baselines directory.
perfguard baseline record MyScenario \
    --csv Profile(20260115_103000).csv \
    --csv Profile(20260115_103127).csv \
    --csv Profile(20260115_103245).csv
Single-capture baselines on noisy stats (GameThreadTime in particular) lock the reference to whatever value that one capture happened to produce. Multi-capture median is the most effective way to stop a static project from flapping FAIL/PASS between runs.
Compare Against Baseline
After making code or content changes, run the scenario again and compare the new CSV against your recorded baseline.
python3 perfguard_cli.py baseline compare MyScenario \
    --csv Saved/Profiling/CSV/Profile(20260116_142200).csv \
    --threshold-percent 5.0 \
    --budget 60fps
python perfguard_cli.py baseline compare MyScenario ^
    --csv Saved\Profiling\CSV\Profile(20260116_142200).csv ^
    --threshold-percent 5.0 ^
    --budget 60fps
The CLI exits with code 0 if all stats are within threshold, or 1 if any regression is detected. This exit code is what CI pipelines use for pass/fail gating.
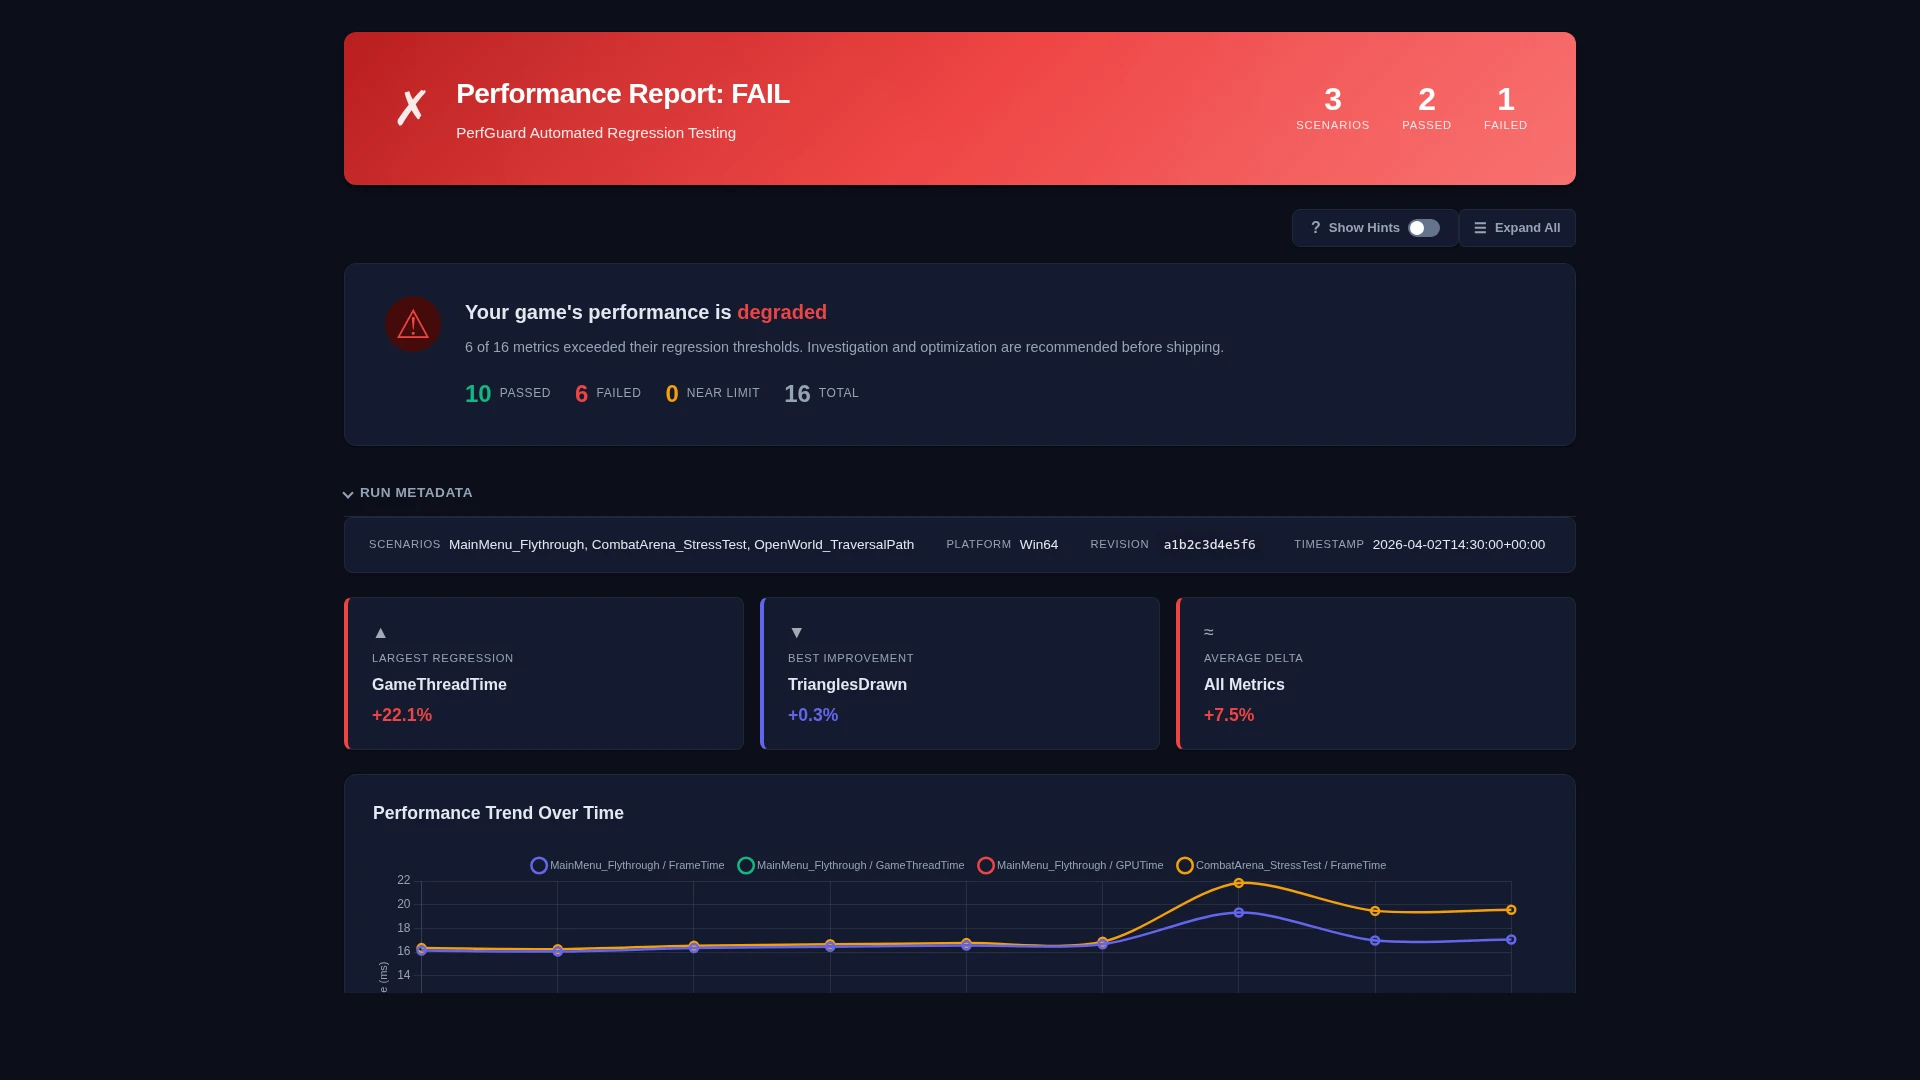
Generate an HTML Report
Generate a self-contained HTML report with charts, tables, and diagnostics that you can share with your team or attach to a pull request.
python3 perfguard_cli.py report results/ \
    --output report.html
python perfguard_cli.py report results\ ^
    --output report.html
Open report.html in any browser. The report is fully self-contained with no external dependencies — Chart.js is embedded inline.
View Reports in the Dashboard
For an interactive experience with working action buttons, use the built-in dashboard server instead of opening the HTML file directly:
python3 perfguard_cli.py dashboard \
    --project-dir . \
    --ue-root /path/to/UnrealEngine \
    --results-dir Saved/PerfGuard/Results
This starts a local server (default port 8076) and opens your browser. The dashboard provides buttons to:
- New Run — run a full capture and comparison
- Update Baseline — re-record the baseline
- Clear All — wipe all data and start fresh
report.html), but the action buttons will be disabled — they require the dashboard server to function.
Next Steps
You've completed the basics. Here's where to go from here:
- Authoring Performance Scenarios — set up comprehensive tests with Level Sequences, Replays, or Duration Only captures
- CI/CD Pipeline Setup — automate regression testing in your build pipeline
- Advanced Threshold Tuning — after 5+ runs, use
perfguard baseline auto-tuneto get statistically-grounded threshold recommendations - Scenario Browser — open PerfGuard → Scenario Browser in the editor for a dockable panel listing all scenarios with Open, Validate, and Run buttons
- Validate Scenarios — run
UnrealEditor-Cmd YourProject.uproject -run=PerfGuard -scenario=MyScenariofor fast pre-flight validation (checks scenario asset well-formedness without GPU rendering) - Clean Up — use
perfguard cleanto remove PerfGuard data (baselines, results, or history) when needed
perfguard analyze with multiple CSV captures to compute confidence intervals and identify volatile metrics before trusting your thresholds.