Diagnosing CPU Regressions
Game thread or render thread? Tick budget or garbage collection? A systematic approach to finding and fixing CPU bottlenecks flagged by PerfGuard.
Game Thread vs Render Thread — Which One Regressed?
This is the first question you answer. Everything else flows from it. PerfGuard tracks GameThreadTime and RenderThreadTime separately, and the answer tells you completely different things.
If GameThreadTime regressed: The problem is in gameplay logic. Tick functions, physics simulation, AI evaluation, Blueprint execution, animation evaluation (game-thread portion), garbage collection. This is your game code or the systems it triggers.
If RenderThreadTime regressed: The problem is in draw call submission, visibility/occlusion culling, animation evaluation (render-thread portion), particle system updates, or scene proxy management. The render thread prepares work for the GPU.
If both regressed proportionally: More stuff in the scene. More actors means more ticking on the game thread AND more draw calls on the render thread. This usually points to a content change (new level section loaded, more spawned actors) rather than a code change.
Check PerfGuard's hitch analysis too. The bottleneck attribution on each hitch tells you which thread was the limiter for that specific frame.
Game Thread Bottlenecks
The game thread runs your world. Every actor that ticks, every component that updates, every physics body that simulates — it all happens here (or is dispatched from here). The game thread budget at 60fps is 16.67ms. Every millisecond counts.
The tick budget: Every actor and component with ticking enabled consumes game thread time every frame. Most developers underestimate this. A single actor's Tick function might cost 0.01ms. But 500 of them cost 5ms, which is 30% of your frame budget at 60fps.
Common culprits:
- Blueprint Tick events doing work every frame that could be event-driven
- Heavy C++ Tick functions (gameplay systems, custom managers)
- Physics simulation with too many active bodies
- AI behavior tree services and EQS queries running at high frequency
- Navigation mesh queries for pathfinding
stat Game          # Overall game thread breakdown
stat Anim          # Animation evaluation costs
stat Physics       # Physics simulation costs
dumpticks          # Lists ALL registered tick functions, their tick group, and state
Fix patterns:
- Disable tick on dormant actors — if it's not visible or relevant, it shouldn't tick
- Use timers instead of per-frame checks (check every 0.5s instead of every frame)
- Move heavy work to async tasks with
FRunnableorAsyncTask - Set tick intervals on components that don't need per-frame updates
- Use significance manager to reduce update frequency for distant/off-screen actors
dumpticks is the most underused command in UE. It lists every registered tick function, its tick group, and whether it's enabled. Use it to find actors that shouldn't be ticking. For actual per-tick timing, use Unreal Insights or stat Game.
Blueprint vs Native Performance
Blueprints are not slow. Blueprints running expensive operations every frame are slow. The distinction matters because the fix is different.
The Blueprint VM has overhead per executed node, not per graph. A Blueprint with 200 nodes but only 5 that execute per frame is fine. A Blueprint with 10 nodes that each iterate over 1000 actors is a disaster.
Common Blueprint performance traps:
ForEachLoopover large arrays in Blueprint TickGet All Actors of Classcalled every frame (iterates the entire actor list)- Heavy math in Blueprint (matrix operations, vector math in tight loops)
- String operations in Blueprint (string building, parsing, formatting per frame)
- Spawning/destroying actors in Blueprint Tick instead of pooling
The Blueprint Profiler in the editor is your primary tool for narrowing down which graph and which nodes are expensive. Enable it from the Blueprint editor toolbar.
Fix patterns:
- Cache actor references instead of searching every frame
- Use component queries over actor queries (Get Components by Class is cheaper than Get All Actors)
- Move hot loops to C++ — even a simple function library callable from BP helps
- Replace Tick with event-driven patterns (delegates, timers, overlap events)
Physics Costs
Physics is one of the most expensive game thread systems, and its cost scales non-linearly with complexity. Doubling the number of simulating bodies can more than double the simulation cost due to broadphase and narrowphase collision detection.
Chaos solver: UE5 uses the Chaos physics engine. Solver iterations and substeps directly multiply the simulation cost. The default settings are reasonable for most games, but someone cranking up substeps "for accuracy" can blow the physics budget.
Collision complexity: Per-poly collision (using the actual mesh triangles for collision) is orders of magnitude more expensive than simple collision shapes. A single mesh with per-poly collision can cost more than 100 meshes with box collision.
stat Physics       # Physics simulation time breakdown
stat Collision      # Collision detection costs

# Physics tuning
p.Chaos.Solver.Iterations           # Solver iteration count
p.MaxPhysicsDeltaTime               # Max physics step size
p.MaxSubsteps                       # Max substeps per frame
Fix patterns:
- Use simple collision shapes (boxes, spheres, capsules) instead of per-poly collision
- Reduce simulation frequency for distant objects using physics sleep distance
- Put physics bodies to sleep when they stop moving (enable auto-sleep)
- Limit solver iterations to the minimum needed for visual quality
- Use collision channels to reduce broadphase pair count — objects that never need to collide should be in non-overlapping channels
Animation & Skeletal Mesh Costs
Animation evaluation is split between game thread (AnimGraph evaluation, state machine logic) and worker threads (bone transforms, blend operations). For a game with many animated characters, this can dominate the frame budget.
Key cost drivers:
- Bone count — More bones = more transforms to compute. A 200-bone character costs significantly more than a 50-bone one.
- Animation Blueprint complexity — Multiple state machines, many blend nodes, IK chains. Each AnimBP node executes per evaluation.
- Cloth simulation — Physics-based cloth is expensive and often overlooked. A single character with cloth can cost as much as 10 without.
- Skeletal mesh LOD — Unlike static meshes, skeletal mesh LODs reduce bone count at distance, directly cutting evaluation cost.
stat Anim                  # Animation evaluation costs
stat AnimBudgetAllocator    # Budget allocator stats (if enabled)

# Animation optimization settings
a.URO.Enable 1              # Enable Update Rate Optimization
a.URO.ForceAnimRate         # Force animation update rate
Fix patterns:
- Enable Update Rate Optimization (URO) — reduces animation evaluation frequency for distant characters
- Use the Animation Budget Allocator to cap total animation cost per frame
- Reduce bone count at distance with skeletal mesh LODs
- Disable cloth simulation at distance or for off-screen characters
- Simplify AnimBP for distant characters (fewer state machines, simpler blends)
AI & Navigation
AI systems are sneaky performance killers because they feel lightweight in isolation but scale terribly. One behavior tree evaluating per tick is nothing. Fifty of them running EQS queries while pathfinding simultaneously is a problem.
Behavior tree evaluation: UE5 behavior trees use an event-driven model — decorators re-evaluate when relevant Blackboard values change, not necessarily every tick. The tree traversal itself is cheap, but the tasks and services it runs can be expensive — especially if they call into other systems (line-of-sight traces, perception queries, EQS). Services do run at configurable intervals, which can add up across many agents.
EQS queries: The Environment Query System is powerful but expensive. Each query tests multiple items against multiple tests. An EQS query running every tick on 30 AI agents is a recipe for game thread starvation.
Navigation pathfinding: Navmesh path queries are O(n) in path length and can be expensive for long paths or complex navmeshes. Many agents requesting paths simultaneously causes spikes.
stat AI             # AI system costs
stat Navigation      # Pathfinding and navmesh costs

# AI performance tuning
# Stagger AI updates — not all agents need to query every frame
Fix patterns:
- Stagger AI updates — not all agents need to evaluate every frame. Use tick intervals of 0.1-0.5s
- Cache pathfinding results and re-use until the destination changes
- Use simpler behaviors for distant AI (reduce perception range, disable EQS)
- Limit EQS query frequency with cooldown timers, not per-tick evaluation
- Use AI perception system efficiently — reduce sense update intervals for non-critical agents
Garbage Collection Spikes
Garbage collection is the number one cause of "random hitches that don't correlate with anything in the scene." GC in UE is a stop-the-world operation on the game thread. When it runs, everything pauses while it scans the UObject graph for unreachable objects.
GC is triggered when the UObject pool grows past a threshold. The more objects you allocate and discard, the more frequently GC runs and the more work it has to do each time.
How to identify GC hitches:
- They appear as periodic spikes in game thread time (every few seconds)
- PerfGuard's hitch detection will catch them as clusters of game-thread-bound hitches at regular intervals
- The spike duration depends on UObject count — more objects = longer GC pause
stat GC                                    # GC timing and frequency
gc.TimeBetweenPurgingPendingKillObjects    # Seconds between GC (default: 61)
gc.MaxObjectsNotConsideredByGC             # Objects below this count skip GC
obj list                                    # Count UObjects by class
Fix patterns:
- Pool actors instead of spawn/destroy cycles — reuse instances to avoid GC churn
- Reduce UObject allocations in gameplay code (prefer structs over UObject subclasses)
- Use object recycling for projectiles, effects, and other frequently spawned objects
- Tune GC frequency with
gc.TimeBetweenPurgingPendingKillObjectsto spread the cost - Incremental GC options can reduce per-frame pause at the cost of more total GC time
Render Thread Bottlenecks
The render thread does all the CPU-side work to prepare rendering commands for the GPU. It runs in parallel with the game thread, but if it takes longer than the game thread, it becomes the frame bottleneck.
Common render thread costs:
- Visibility and occlusion culling — Determining which objects are visible. Scales with total actor count in the scene, not just visible count.
- Draw call preparation — Sorting, batching, building command buffers. More objects = more work.
- Particle system evaluation — Niagara CPU emitters tick on the game thread (or worker threads). GPU emitters run on the GPU but still have CPU-side overhead for spawning and parameter updates. Render-thread cost comes from data finalization and draw call preparation.
- Skeletal mesh updates — Bone buffer uploads and morph target evaluation happen on the render thread.
stat Threading          # Game thread vs render thread timing
stat SceneRendering     # Scene rendering breakdown
stat InitViews          # Visibility determination cost
Fix patterns:
- Reduce actor count in view — merge small static actors, use Nanite to reduce draw calls
- Use HLOD (Hierarchical Level of Detail) for distant geometry clusters
- Set up Precomputed Visibility Volumes for indoor scenes with clear occlusion boundaries
- Limit particle system count — prefer GPU particles over CPU particles
- Use distance-based culling for small objects that aren't visible beyond a few hundred meters
Memory & Cache Pressure
Memory issues don't always manifest as obvious crashes. Often they show up as gradual performance degradation: the OS starts paging to disk, CPU caches thrash on large data structures, and everything gets slower without a clear single cause.
PerfGuard tracks memory: The PhysicalMemoryMB and VirtualMemoryMB stats in your captures tell you if memory is growing during the capture. PerfGuard's memory leak detection flags monotonically increasing memory, which is a strong signal something is accumulating and not being released.
Common memory regression causes:
- Asset references held after they're no longer needed (preventing GC from collecting them)
- Actor pools that grow but never shrink
- Texture streaming pool overcommitted (streaming in more textures than the pool can hold)
- Unreleased render targets or dynamic textures
memreport -full      # Comprehensive memory report to log file
stat Memory            # Real-time memory overview
stat LLM               # Low Level Memory tracker (detailed)
obj list               # UObject count by class
Fix patterns:
- Profile with Unreal Insights memory trace to find allocation sources
- Check for unintended strong references keeping objects rooted — UE's tracing GC can collect unreachable cycles, but if one object in a chain is rooted (e.g., referenced by a persistent actor), the entire chain stays alive. Use
TWeakObjectPtrfor non-owning references. - Use weak pointers (
TWeakObjectPtr) for references that shouldn't prevent GC - Implement proper level streaming — unload sublevels when the player moves away
- Cap actor pool sizes and recycle rather than grow indefinitely
stat commands have overhead. Don't profile with 20 stat windows open simultaneously — the act of measuring will distort your measurements. Enable one or two at a time, get the data you need, and disable them.
Systematic CPU Investigation Workflow
Same as with GPU regressions, follow a structured process. Don't guess.
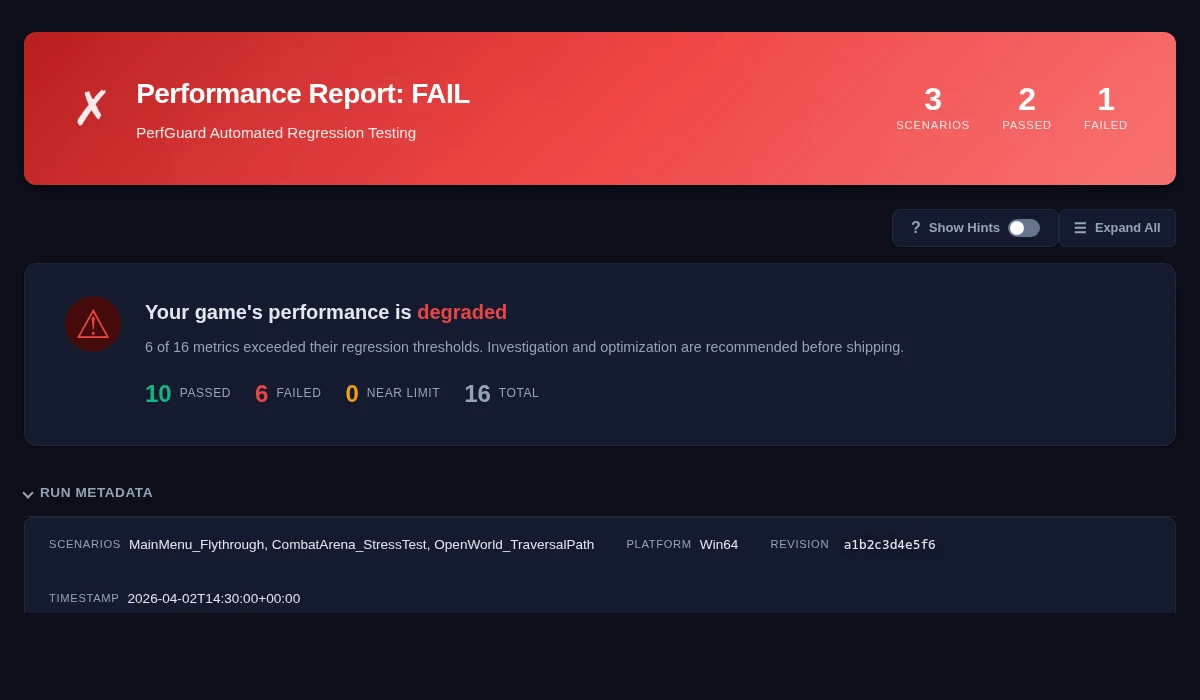
- Start with the PerfGuard report — Identify whether GameThreadTime or RenderThreadTime (or both) regressed.
- Check hitch analysis — Look at bottleneck attribution. Are hitches game-thread-bound or render-thread-bound? Are they periodic (GC) or sustained (tick budget)?
- Load the scene in editor — Use the appropriate stat commands to narrow the category. Start with
stat Gameorstat Threading. - Narrow to subsystem — Is it physics? Animation? AI? Tick? GC? Each has a dedicated stat command.
- Profile with Unreal Insights — For per-function CPU timing, Unreal Insights CPU traces show exactly which functions are consuming time on which thread.
- Fix, re-capture, verify — Make the change, run PerfGuard again, confirm the regression is resolved.