Diagnosing GPU Regressions
PerfGuard flagged a GPU regression. Now what? A systematic approach to tracking down exactly what changed in the rendering pipeline, from draw calls to Nanite to Lumen to VRAM pressure.
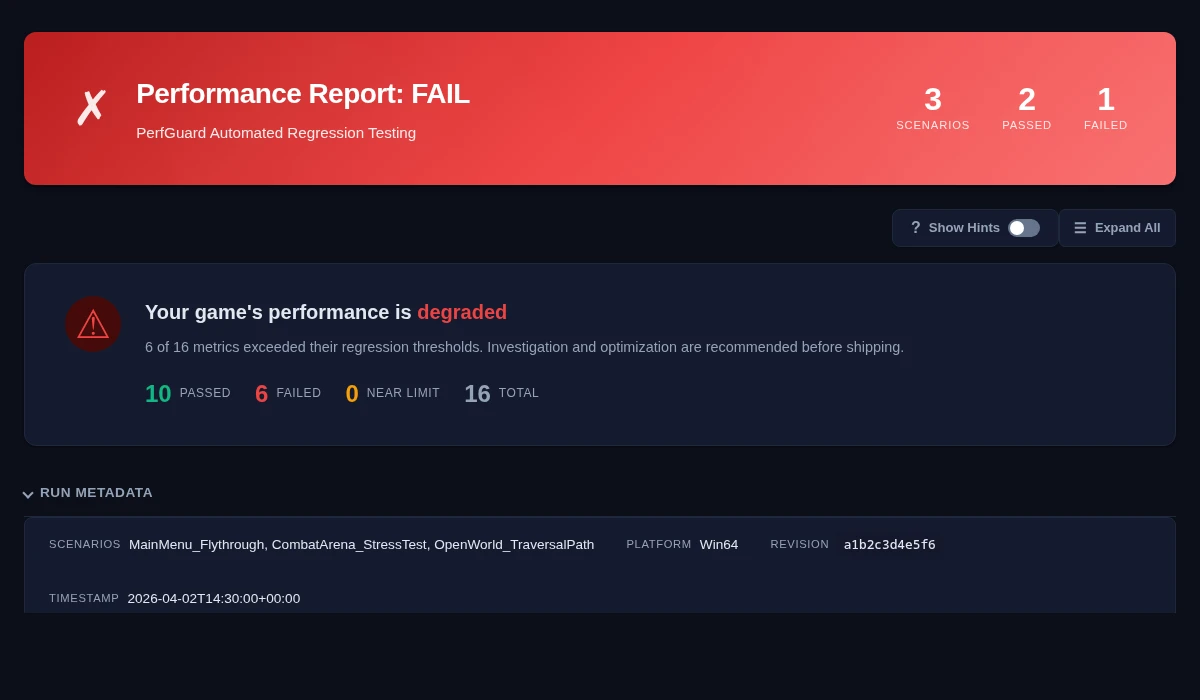
PerfGuard Says GPUTime Regressed — Now What?
Before you start tearing apart shaders, take a breath and verify the regression is real. Not every red number in a report means someone broke something. Hardware is noisy, and GPUs are especially sensitive to thermal state.
First, check the data quality indicators:
- Coefficient of Variation (CoV) — If GPUTime has a CoV above 10%, the stat is volatile. A 5% regression on a 12% CoV stat is noise, not signal.
- Thermal detection — Check the diagnostics card. If PerfGuard detected thermal throttling, your GPU was slowing down over the capture. The regression might be heat, not code.
- Hitch analysis — Look at the hitch bottleneck attribution. If hitches are flagged as GPU-bound, you have a real GPU problem. If they're game-thread-bound, the GPU regression might be secondary.
Then, cross-reference related stats:
- Did
DrawCallsincrease alongsideGPUTime? That points to scene complexity. - Did
TrianglesDrawnjump? More geometry on screen. - Did both stay flat while
GPUTimerose? Shader or render pass cost increased.
Only after confirming the regression is real and identifying the correlated stats should you open the editor and start profiling.
Understanding the GPU Pipeline in UE5
You don't need a PhD in graphics to diagnose GPU regressions, but you do need a working mental model of where time goes. Here's the practical version.
How UE5 renders a frame: The CPU (game thread and render thread) builds a list of draw commands and submits them to the GPU via the RHI thread. The GPU then executes the pipeline: vertex processing (transform geometry) → rasterization (convert triangles to fragments) → pixel shading (write to GBuffers in the base pass). UE5 uses a deferred renderer by default — the base pass writes material properties to GBuffers, then a separate lighting pass computes final color. Post-process, translucency, and shadows are additional passes. Each pass can be the bottleneck depending on your scene.
What Nanite changed: Nanite virtualizes geometry. It runs a software rasterizer on the GPU for small triangles (faster than hardware rasterization at that scale) and falls back to hardware rasterization for large triangles. The practical implication: triangle count matters less than it used to, but Nanite has its own overhead that shows up differently in profiling.
What Lumen changed: Lumen provides dynamic global illumination and reflections through a combination of software ray tracing (screen traces, surface cache) and optional hardware ray tracing. It adds several new render passes that didn't exist before: screen probe gather, surface cache updates, reflection traces. These costs are highly scene-dependent.
Virtual Shadow Maps: VSM replaced traditional cascaded shadow maps with a virtualized page-based system. It caches shadow data per page and only re-renders pages that are invalidated by moving objects. When it works well, it's faster than cascaded shadows. When cache invalidation gets out of hand (lots of moving objects, animated foliage), it can be significantly more expensive.
The key diagnostic insight: if TrianglesDrawn went up but DrawCalls didn't, Nanite is doing more work (more clusters visible). If DrawCalls went up but TrianglesDrawn is flat, you have more draw submissions from non-Nanite objects or material changes.
Draw Call Regressions
Draw calls remain one of the most common GPU performance issues, even with Nanite. Every draw call has CPU-side overhead (state setup, command buffer recording) and GPU-side cost (pipeline state changes). More draw calls = more overhead on both sides.
Common causes of draw call increases:
- New meshes added to the scene without LOD or culling consideration
- Material complexity forcing separate draws (multiple material IDs per mesh)
- Mesh merging broken by a content change (HLOD rebuild needed)
- Instanced Static Meshes (ISM/HISM) not used for repeated geometry
- Static vs dynamic path: dynamic objects can't be batched as aggressively
# In-editor or runtime console
stat SceneRendering    # "Mesh draw calls" is the key number
stat GPU               # Per-pass GPU timing breakdown
stat RHI               # Draw call count, triangles, primitives
Fix patterns:
- Merge static actors in the editor (Actor Merge tool)
- Use Hierarchical Instanced Static Meshes (HISM) for repeated geometry like foliage, props, modular pieces
- Reduce material IDs per mesh — each material slot is a separate draw
- Enable Nanite for high-poly static meshes to leverage its draw call reduction
- Rebuild HLODs after content changes to restore distance-based simplification
Overdraw & Shader Complexity
Overdraw means the GPU is shading the same pixel multiple times. In a well-optimized scene, most pixels are shaded once (opaque base pass). In a poorly optimized scene, translucent materials, particles, decals, and post-process volumes can push that to 4-8x or worse.
The translucency cost trap: Every translucent surface layer is expensive. Unlike opaque objects that benefit from early-Z rejection, translucent objects must be shaded back-to-front. A smoke effect with 200 overlapping particles each doing texture lookups and lighting is a pixel shader nightmare.
Shader complexity: Even without overdraw, a single material can be expensive if it has too many texture samples, complex math nodes, or branching logic. Material graphs that look clean in the editor can compile to horrifically long shader code.
# Visualization modes (editor viewport)
viewmode ShaderComplexity       # Heat map of pixel shader cost
viewmode QuadOverdraw           # Quad overdraw visualization
viewmode LightComplexity         # Light overlap and cost

# Runtime stats
stat GPU                         # Translucency pass timing
stat Particles                   # Particle system costs
Fix patterns:
- Reduce particle overdraw: use GPU particles with distance culling, fewer but larger particles, sprite sheet animations instead of layered effects
- Simplify materials: fewer texture samples, use Material Quality Level switches for scalability
- Limit post-process overlay count — each post-process material is a full-screen pass
- Convert translucent materials to masked (alpha-tested) where visual quality allows it
- Use decal distance culling to avoid stacking decals at close range
viewmode ShaderComplexity in the editor is the single fastest way to find overdraw hot spots. Red and white areas are where your GPU budget is going. Walk the camera through the scene and look for areas that light up.
Lumen-Specific Regressions
Lumen is the most common source of "surprise" GPU regressions in UE5 projects. Its costs are scene-dependent, non-obvious, and can change dramatically from small content tweaks.
Surface cache invalidation: Lumen builds a surface cache of the scene for software ray tracing. When objects move, deform, or change materials, the affected surface cache cards must be re-traced. A few moving characters is fine. A hundred animated foliage actors will hammer the surface cache every frame.
Screen probe density: Lumen uses screen-space probes to gather indirect lighting. More probes = better quality but higher cost. The probe density and cascade count are configurable, and someone might have cranked them up without realizing the GPU cost.
GI method changes: One of the most common causes of GPU regression in a Lumen project is someone accidentally switching the Global Illumination method. If it was set to Lumen and someone changed it to Screen Space Global Illumination (SSGI), or vice versa, the performance characteristics change completely.
# Lumen screen probe settings
r.Lumen.ScreenProbeGather.RadianceCache.NumProbesToTraceBudget
r.Lumen.Reflections.MaxRoughnessToTrace

# Lumen detail tracing
r.Lumen.TraceMeshSDFs
r.Lumen.ScreenProbeGather.RadianceCache.NumProbesToTraceBudget

# Check current GI method
r.DynamicGlobalIlluminationMethod   # 0=None, 1=Lumen, 2=SSGI
r.ReflectionMethod                  # 0=None, 1=Lumen, 2=SSR
Fix patterns:
- Reduce dynamic object count in Lumen scenes — each moving object invalidates surface cache
- Disable mesh SDF tracing where not needed via
r.Lumen.TraceMeshSDFs 0per-scene - Mark truly static objects as Static mobility (not Stationary) so Lumen can cache them efficiently
- Reduce screen probe step count if quality allows
- Verify nobody changed the GI or reflection method in post-process volumes or project settings
Virtual Shadow Maps
Virtual Shadow Maps (VSM) replace traditional cascaded shadow maps with a page-based caching system. When it works, it's elegant: shadow pages are cached and only re-rendered when invalidated. When it doesn't work, cache invalidation storms can be worse than the old system.
Cache invalidation causes:
- Objects moving every tick (even slightly) — each movement invalidates shadow pages
- Foliage animation (wind-blown trees, grass) — thousands of shadow casters moving every frame
- High character density — many shadow-casting characters in view
- Light source movement — directional light changes invalidate everything
Page pool exhaustion: VSM has a fixed memory budget for shadow pages (r.Shadow.Virtual.MaxPhysicalPages). When the budget is exhausted, pages get evicted and must be re-rendered next frame. This creates a feedback loop of constant re-rendering that tanks GPU performance.
stat ShadowRendering            # Shadow pass costs
r.Shadow.Virtual.MaxPhysicalPages  # Page pool budget (default: 4096)
r.Shadow.Virtual.Cache             # 0=disable caching (debug only)

# Visualization
r.Shadow.Virtual.Cache 0           # Disable caching to test uncached cost
Fix patterns:
- Reduce shadow-casting light count — all lights share a single physical page pool, and more lights means more pages consumed
- Use distance culling for shadow casters — small objects far from camera don't need shadows
- Disable shadows on small or unimportant objects (debris, small props)
- Disable shadow casting on foliage that uses Wind node — it invalidates pages every frame
- Increase page pool budget if VRAM allows, or reduce shadow resolution for distant lights
Nanite Regressions
Nanite is usually a net win for performance, but it has its own cost profile that can regress in specific situations.
Software rasterizer overhead: When the camera gets close to very dense geometry (zoomed into detailed foliage, architectural detail), Nanite's software rasterizer processes more clusters. This is GPU compute work, and it scales with the number of visible micro-triangles.
Fallback meshes: Not everything can be Nanite. Skeletal meshes, translucent materials, and some particle meshes fall back to the traditional rendering pipeline. If your scene has a mix of Nanite and non-Nanite assets, the non-Nanite objects still contribute draw calls and traditional GPU cost. A new batch of non-Nanite props can cause a regression even in a heavily Nanite scene.
Overdraw through Nanite passes: Nanite handles opaque geometry efficiently, but the materials applied to Nanite meshes still have pixel shader cost. Complex materials on Nanite meshes don't get a free pass.
stat Nanite                       # Nanite-specific timing
r.Nanite.Visualize.Triangles 1     # Shows triangle density
r.Nanite.Visualize.Overdraw 1      # Nanite-specific overdraw

# Check which meshes are using Nanite vs fallback
# Also available via Viewport > Lit > Nanite Visualization
Fix patterns:
- LOD your non-Nanite meshes aggressively — they don't have Nanite's automatic LOD
- Enable Nanite on high-poly static assets that currently use traditional rendering
- Watch for Nanite fallback on translucent materials — Nanite can't render translucency
- Reduce material complexity on Nanite meshes — the pixel shader still runs per pixel
stat Nanite shows high rasterization time, the bottleneck is the cluster visibility and rasterization compute passes, not traditional vertex shading.
RHI Thread & GPU Submission
The RHI (Rendering Hardware Interface) thread translates UE's rendering commands into API-specific calls (D3D12, Vulkan, Metal). Bottlenecks here show up as gaps between the render thread finishing work and the GPU actually executing it.
RHI thread stalls: Too much state-change overhead — frequent pipeline state switches, resource barrier thrashing, or descriptor heap management. This is rare in most games but can happen with extreme material diversity or many render targets.
PSO compilation hitches: Pipeline State Objects (PSOs) describe the full GPU pipeline configuration for a draw call. When a PSO is needed for the first time and hasn't been precached, it must be compiled on the fly. This causes a hard stall — a single-frame hitch that can be 50-200ms.
# Cook with PSO precaching enabled
# Enable PSO precaching in Project Settings > Rendering > Pipeline State Object Precaching
# Or via CVar:
r.PSOPrecaching 1

# Collect PSO data from a run
r.ShaderPipelineCache.Enabled 1
r.ShaderPipelineCache.SaveBoundPSOLog 1

# Check PSO compilation stats at runtime
stat PipelineStateCache
Fix patterns:
- Precache PSOs during cooking — this eliminates first-run compilation hitches
- Reduce material permutations — fewer unique shader combinations = fewer PSOs to compile
- Use shared material instances instead of unique material instances per actor
- Enable PSO bundled precompilation in project settings for target platforms
Memory Bandwidth & VRAM
GPU performance isn't just about compute. Memory bandwidth and VRAM capacity are often the silent bottleneck, especially on mid-range hardware or when texture quality gets out of hand.
Texture streaming pool exhaustion: UE has a configurable texture streaming pool (r.Streaming.PoolSize). When the pool is full, the engine starts evicting textures and streaming in replacements constantly. This creates a feedback loop of GPU stalls waiting for texture uploads.
VRAM pressure: When total VRAM usage exceeds the GPU's physical memory, the driver starts paging to system RAM over PCIe. This is catastrophically slow — GPU performance can drop dramatically for affected draw calls as system RAM bandwidth over PCIe is far lower than VRAM bandwidth.
stat TextureStreaming    # Pool usage, over-budget amount
r.Streaming.PoolSize    # Current pool size in MB

# Memory overview
stat RHI                 # VRAM allocations
stat Memory              # System memory breakdown
rhi.DumpMemory          # Detailed GPU memory dump
Fix patterns:
- Use appropriate texture compression formats per platform (BC7 for quality, BC1 for size)
- Enable Virtual Textures for large open worlds to reduce resident texture memory
- Reduce max texture size for objects that are typically viewed at distance
- Limit unique texture count per scene — reuse textures with material instances
- Increase
r.Streaming.PoolSizeif VRAM headroom exists, or reduce texture quality globally
Systematic GPU Investigation Workflow
When a GPU regression lands in your lap, follow this order. It will save you hours of guessing.
- Start with the PerfGuard report — Identify which GPU stat regressed. Check CoV, thermal detection, and data quality first.
- Cross-reference correlated stats — Look at DrawCalls, TrianglesDrawn, and hitch bottleneck attribution. They tell you where to look.
- Load the scene in editor — Navigate to the camera path used by the scenario. Use
stat GPUto see per-render-pass timing. - Narrow to specific render pass — Is it base pass? Shadows? Translucency? Post-process? Lumen? Each pass points to a different class of problem.
- Use visualization modes —
viewmode ShaderComplexity,r.Nanite.Visualize.*, Nanite Visualization viewport modes to see the problem spatially. - Profile with RenderDoc or Unreal Insights — For per-draw-call GPU timing, RenderDoc frame captures are invaluable. Unreal Insights GPU traces show timing across the full frame.
- Fix and verify — Make the change, re-capture with PerfGuard, confirm the regression is resolved and no new regressions appeared.
-RenderOffScreen are valid but may differ slightly from windowed mode due to composition differences. If your numbers don't match between CI and local testing, this is usually why. The relative deltas should still be consistent.
-nullrhi will produce zero GPU stats. It skips the entire rendering pipeline. Always use -RenderOffScreen for headless GPU profiling. This is the most common CI configuration mistake.