Performance Testing Best Practices
Hard-won lessons from years of shipping titles. How to set up reliable performance testing that actually catches regressions without drowning your team in false positives.
Hardware Isolation is Everything
I've seen teams spend months building sophisticated statistical analysis to compensate for noisy test environments, when the real fix was a $2,000 dedicated machine in a closet. No amount of math can fix a fundamentally unreliable measurement environment.
Why dedicated hardware matters:
- Thermal consistency — A developer's workstation under a monitor heats up differently every day. A rack-mounted machine in a server room has consistent thermals.
- No background processes — Slack, Chrome, virus scanners, Windows Update, Steam, Discord — they all steal CPU time and cause hitches that look like regressions.
- Driver stability — A developer updates their GPU driver and suddenly performance changes. Your test machine should update drivers on a known schedule, not randomly.
Budget option: One dedicated workstation, run tests during off-hours (nightly builds). Disable all non-essential services, auto-login, and let PerfGuard run via CI trigger at 2 AM.
Enterprise: Rack-mounted GPU server in a temperature-controlled room. Consistent power, consistent thermals, no human interference. This is what AAA studios use and it's worth every penny.
Thermal Management
GPUs and CPUs throttle when they get hot. This is not a theoretical concern — it's a practical one that will corrupt your performance data if you ignore it.
A modern GPU under sustained load will start throttling after 5-10 minutes. The throttle is gradual: you'll see frame times drift upward over the course of a capture. PerfGuard detects this (thermal throttle detection in the diagnostics card), but even detected throttling means your data is compromised.
Mitigation strategies:
- Cool-down periods — Wait 2-5 minutes between consecutive captures. Let the GPU clock back up to boost frequency.
- Shorter captures — 30-60 seconds is more thermally stable than 5 minutes. You get enough frames for statistical validity without entering the throttle window.
- Environment — Air-conditioned server rooms are ideal. If using a workstation, ensure good airflow. Laptops are the worst option for perf testing.
- Fan curves — On dedicated test machines, set GPU fans to 100% via driver settings. Noise doesn't matter in a server room.
Designing Scenarios for Coverage
A single camera flythrough through the pretty part of your level is not a performance test suite. It's a demo. Real performance testing requires deliberate scenario design that covers the expensive parts of your game.
Scenario types to consider:
- Worst-case flythrough — Camera path through the most expensive view in the level. The view where your art director says "this looks amazing." That's the expensive one.
- Typical gameplay view — What the player actually sees during normal gameplay. Often less expensive than the worst case but more representative.
- Streaming boundary crossing — Camera moving through level streaming boundaries. This catches streaming hitches and memory spikes.
- Particle-heavy areas — Explosions, weather effects, environmental particles. These stress overdraw and GPU fill rate.
- High actor density — Crowds, battlefields, dense foliage. Stresses both CPU (tick, physics, AI) and GPU (draw calls, shadows).
Multiple short scenarios beat one long scenario. Each scenario is thermally independent, isolates a specific concern, and gives you specific feedback about what regressed. A single 5-minute flythrough that covers everything tells you "something is slower" without telling you what.
# Name scenarios by what they stress
PS_CityLevel_WorstCaseVista    # GPU-heavy skyline view
PS_CityLevel_StreamingCross    # Level streaming boundary
PS_Arena_MaxPlayers            # CPU-heavy high actor count
PS_Arena_ParticleAlley         # Overdraw stress test
PS_OpenWorld_VehicleTraversal  # Streaming + physics
Warmup Strategy
The first few seconds of any capture are garbage data. Shader compilation, texture streaming, Nanite DAG construction, Lumen surface cache population — all of these happen on first load and corrupt your measurements if included.
PerfGuard skips a configurable number of warmup frames before measurement begins. Getting this number right is the difference between noisy data and clean data.
Recommended warmup frames by scene type:
- Simple indoor scene — 30-60 frames. Limited textures, no streaming, few shaders.
- Open world with streaming — 120-180 frames. Texture streaming needs time to fill the pool. Nanite needs to build its hierarchy.
- Heavy shader compilation — 180-300 frames. First-run PSO compilation can take hundreds of frames to settle. Consider PSO precaching to avoid this entirely.
# Record a baseline with 120 warmup frames
perfguard baseline record MyScenario \
    --csv capture.csv \
    --warmup 120

# Compare with matching warmup
perfguard baseline compare MyScenario \
    --csv new_capture.csv \
    --warmup 120
How to validate your warmup setting: Run the same scenario twice on the same machine. If the first run is consistently worse than the second, your warmup is too short — first-run transient costs are leaking into your measurement window. Increase warmup until both runs produce equivalent results.
Too little warmup gives you noisy first captures. Too much wastes CI time. Find the balance for your project and document it.
Threshold Tuning Philosophy
Thresholds are the single most important configuration in PerfGuard, and getting them wrong in either direction is equally bad.
Too tight (1-2%): False positives on every run. The team learns to ignore alerts. When a real regression happens, nobody notices because the alert fatigue is already terminal. I've seen this kill performance testing programs at multiple studios.
Too loose (20%+): Real regressions slip through unnoticed. By the time a 25% regression accumulates from multiple smaller changes, nobody knows which commit caused it and the fix is ten times harder.
The sweet spot:
- 3-5% for timing stats (FrameTime, GPUTime, GameThreadTime) — Tight enough to catch meaningful regressions, loose enough to tolerate hardware noise.
- 10-15% for count stats (DrawCalls, TrianglesDrawn) — These naturally vary more due to LOD transitions, culling differences, and batching variance.
Use different thresholds for different stats. A global 5% threshold means DrawCalls will false-positive constantly while GPUTime misses real regressions. PerfGuard supports per-stat threshold overrides for exactly this reason.
Use auto-threshold recommendations. After 10+ runs of historical data, PerfGuard can analyze the natural variance of each stat and recommend thresholds. This removes the guesswork and adapts to your specific hardware and scenes.
Frame budget presets (60fps, 30fps, VR 90fps) are a good starting point for absolute thresholds, but percentage-based thresholds are better for regression detection.
When to Re-Baseline
Re-baselining means recording new reference values. Do it at the right times and your regression detection stays accurate. Do it at the wrong times and you're hiding problems.
Re-baseline when:
- After intentional optimization — You improved performance. The new numbers are the new standard. Record them.
- After engine upgrade — UE5.4 to 5.5 can change GPU pipeline behavior significantly. Old baselines become meaningless.
- After hardware change — New GPU, different test machine, different driver version. Performance characteristics change.
- After major content change — New level layout, wholesale LOD changes, lighting overhaul. The scene is fundamentally different.
Never re-baseline to hide a regression you don't want to fix. If performance got worse and the team decides it's acceptable, that's a product decision. Document it in the commit message. But don't silently re-baseline to make the red number go green. That's how projects ship at 20fps.
# Re-baseline after optimization work
perfguard baseline record MyScenario \
    --csv optimized_capture.csv \
    --platform Win64

# Always commit baselines with a descriptive message
git add baselines/
git commit -m "Re-baseline: CityLevel GPU optimization (-18% GPUTime)"
Always commit baselines to version control with a descriptive message. Future you will want to know why the baseline changed.
Multi-Scenario Strategy
Not every test needs to run on every commit. Layer your perf testing like you layer your functional tests: fast smoke tests on every PR, deeper suites nightly, full validation before release.
Smoke test suite (every PR, ~5 minutes):
- 2-3 fast scenarios covering the most performance-sensitive areas
- 30-second captures, single run per scenario
- Catches obvious regressions before merge
Nightly regression suite (~20 minutes):
- 6-10 scenarios covering all major areas of the game
- 60-second captures, 1-2 runs per scenario
- Catches regressions that smoke tests miss (streaming, specific level areas)
Release validation (before milestone, ~1 hour):
- Full scenario suite with 3-5 runs per scenario
- Statistical confidence from multi-run analysis
- The definitive "are we shipping performance" check
Gating per tier: tags on a PerfScenario asset surface as report badges and Scenario Browser metadata — they are not used by the CLI to filter runs. Maintain one suite.json per tier and list the scenarios you want in each:
{
  "project": "./Game.uproject",
  "ue_root": "/path/to/UE",
  "scenarios": [
    { "name": "MainMenu_Flythrough" }
  ]
}
{
  "project": "./Game.uproject",
  "ue_root": "/path/to/UE",
  "scenarios": [
    { "name": "MainMenu_Flythrough" },
    { "name": "GameplayLevel_Overview" },
    { "name": "OpenWorld_Drive" },
    { "name": "Combat_Replay" }
  ]
}
Your CI invokes perfguard run smoke.suite.json on every PR and perfguard run release.suite.json on milestone branches. Tags on the underlying PerfScenario assets are still useful: they show up as colored badges on the HTML report and let you filter the in-editor Scenario Browser.
CI Pipeline Architecture
Your perf tests should run on a dedicated machine, not the same one that's compiling code. Build and test are separate stages with different hardware requirements.
The pipeline sequence:
- Build — Compile the project (any machine)
- Deploy — Copy the build to the perf test machine
- Cool-down — Wait 2-3 minutes for thermal state to normalize
- Capture — Run PerfGuard scenarios
- Compare — Compare against baselines
- Report — Generate HTML report, archive, notify
Exit code handling:
# PerfGuard exit codes
# 0 = pass (all scenarios within threshold)
# 1 = fail (regression detected)
# 2 = error (capture failed, missing data, etc.)

perfguard run suite.json --mode compare
EXIT_CODE=$?

if [ $EXIT_CODE -eq 1 ]; then
    echo "Regression detected - failing build"
    exit 1
elif [ $EXIT_CODE -eq 2 ]; then
    echo "Perf test error - investigate separately"
    # Don't fail the build for infrastructure issues
    exit 0
fi
Archive everything. Every report, even passing ones, should be archived. The trend data from passing runs is what makes PerfGuard's auto-threshold and history features work. A failed build without trend context is much harder to diagnose.
PR comment bots: Use PerfGuard's PR comment integration to post the comparison table directly on the PR. Developers see the performance impact before they merge, not after.
Team Culture & Process
"Performance is everyone's responsibility" is a nice sentiment that only works if the tools make it easy. Your job is to make performance visible and actionable so that the team naturally cares about it.
Make the data visible:
- Put the perf dashboard on a TV in the office or team area
- Post daily/weekly perf summaries to a dedicated Slack/Teams channel
- Include perf status in standup alongside build status
Assign ownership:
- Rotate a "performance sheriff" — one person reviews every report for the week
- The sheriff's job is to triage: is this a real regression? Who should investigate? Is it blocking?
- This prevents reports from going unread while spreading performance knowledge across the team
Celebrate improvements: Don't just gate on failures. When someone optimizes a hot path and frame time drops 10%, that deserves recognition. Performance work is often thankless — make it visible.
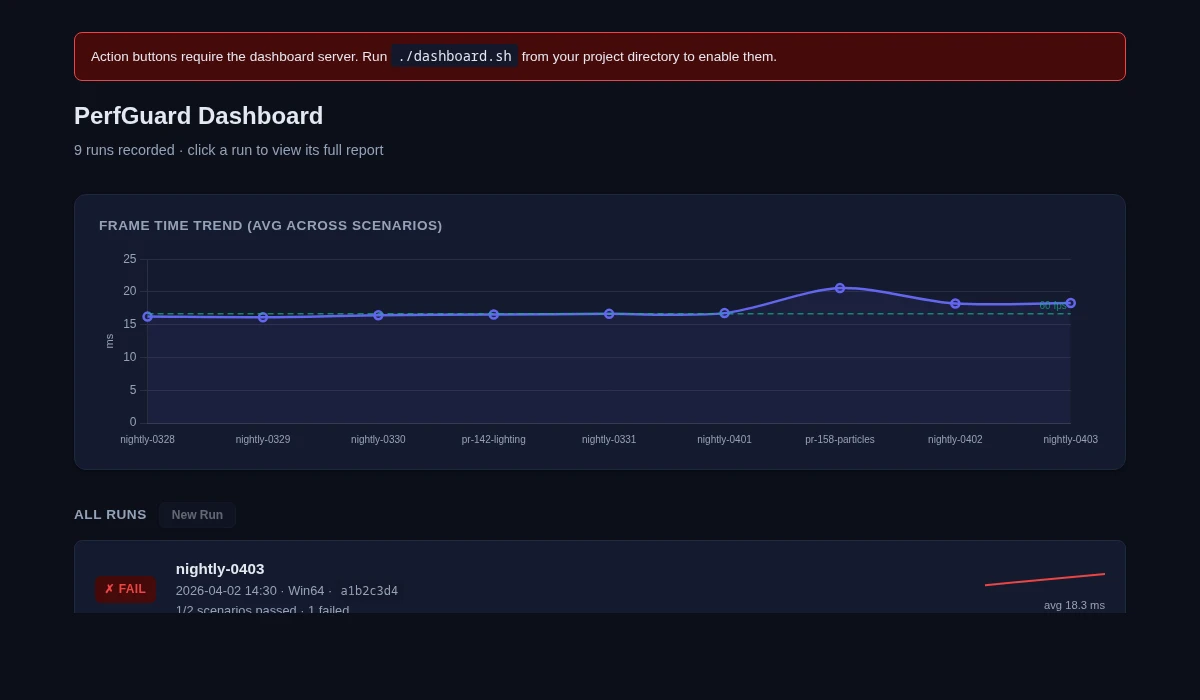
Use trend data for planning: When the trend chart shows a gradual 15% increase over three months from many small changes, that's a signal to schedule optimization work. Use PerfGuard's history data to make evidence-based arguments for optimization sprints.
Common Mistakes & Lessons Learned
Every mistake on this list is one I've either made personally or watched a team make. Learn from our pain.
- Running perf tests on CI VMs without GPUs — All GPU stats are zero. You're testing CPU only and don't even know it. Verify GPU stats are non-zero in your first run.
- Comparing baselines across different hardware — A baseline recorded on a 3090 is meaningless when compared on a 4070. Different GPU architectures have different performance characteristics. Always compare on the same hardware.
- Setting thresholds too tight on day one — Start at 10%, observe the natural variance for a week, then tighten to 3-5% once you understand your noise floor.
- Not warming up enough — First-run shader compilation noise makes everything look 20% slower. Increase warmup frames until first and second runs match.
- Testing only one scenario — A regression in the arena level doesn't show up in the menu flythrough. Cover your expensive areas.
- Never re-baselining after engine upgrades — Everything looks regressed because the rendering pipeline changed. Re-baseline immediately after upgrading UE versions.
- Forgetting to record baselines before a major refactor — You can't measure improvement without a "before" measurement. Always baseline before starting optimization work.