Advanced: Threshold Tuning & Multi-Run Analysis
Reduce false positives and catch real regressions. Learn statistical techniques for reliable performance testing in noisy environments.
Understanding Noise vs Real Regressions
The fundamental challenge of automated performance testing is distinguishing signal from noise. Even on dedicated hardware, frame times vary between runs due to OS scheduling, thermal state, driver behavior, and background services.
A naive comparison (single run A vs single run B) has high false positive rates. PerfGuard uses several techniques to improve signal quality:
- Warmup frame trimming — Removes initial spikes from shader compilation
- IQR outlier removal — Removes extreme values that skew aggregates
- Multi-run aggregation — Averages across multiple captures for statistical confidence
- CoV flagging — Warns when a stat is too volatile to compare reliably
IQR Outlier Trimming Explained
PerfGuard uses the Interquartile Range (IQR) method to remove outlier frames before computing aggregates. This is a robust statistical technique that handles skewed distributions well.
How it works:
- Compute Q1 (25th percentile) and Q3 (75th percentile) of the frame data
- Calculate IQR = Q3 - Q1
- Define bounds: lower = Q1 - 1.5 * IQR, upper = Q3 + 1.5 * IQR
- Discard any frames outside [lower, upper]
- Compute aggregates on the remaining "clean" data
# Raw frame times (ms):
[12.1, 13.4, 13.8, 14.0, 14.2, 14.5, 14.8, 15.1, 15.3, 45.2, 67.8]

# Q1 = 13.8, Q3 = 15.1, IQR = 1.3
# Lower bound = 13.8 - 1.95 = 11.85
# Upper bound = 15.1 + 1.95 = 17.05

# After trimming (45.2 and 67.8 removed):
[12.1, 13.4, 13.8, 14.0, 14.2, 14.5, 14.8, 15.1, 15.3]

# Mean: 14.13ms (vs 19.84ms with outliers)
This prevents shader compilation hitches or GC stalls from inflating your baseline and masking real regressions.
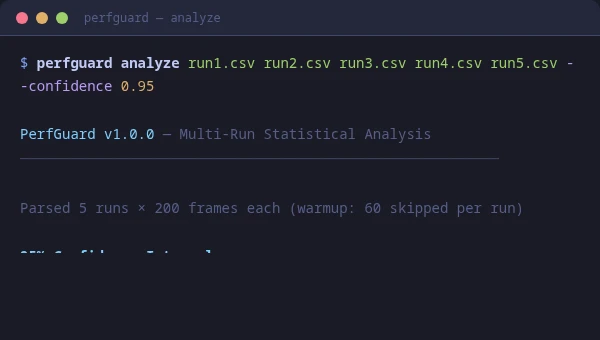
Multi-Run Statistical Analysis
For the highest confidence, run the same scenario multiple times and let PerfGuard compute confidence intervals. This tells you not just the mean, but how confident you can be that the mean is accurate.
# Run 5 captures of the same scenario
for i in 1 2 3 4 5; do
    UnrealEditor Project.uproject -game \
        -gauntlet=PerfGuardGauntletController \
        -scenario=MyScenario -csvprofile \
        -RenderOffScreen -unattended -log
done

# Analyze all 5 runs together
python3 perfguard_cli.py analyze \
    run1.csv run2.csv run3.csv run4.csv run5.csv \
    --threshold-percent 5.0
# Run 5 captures of the same scenario
for ($i=1; $i -le 5; $i++) {
    & "UnrealEditor-Cmd.exe" Project.uproject -game `
        -gauntlet=PerfGuardGauntletController `
        -scenario=MyScenario -csvprofile `
        -unattended -log
}

# Analyze all 5 runs together
python perfguard_cli.py analyze `
    run1.csv run2.csv run3.csv run4.csv run5.csv `
    --threshold-percent 5.0
With 5 runs, PerfGuard computes 95% confidence intervals. A regression is only flagged if the lower bound of the confidence interval exceeds the threshold — meaning you can be statistically confident the regression is real, not noise.
Coefficient of Variation (CoV) Flagging
The Coefficient of Variation (CoV) is the standard deviation divided by the mean, expressed as a percentage. It measures how "noisy" a stat is relative to its magnitude.
PerfGuard flags stats with CoV above a configurable threshold (default: 10%). A high CoV means the stat varies too much between frames to produce reliable comparisons.
# Low CoV (good, reliable comparison):
FrameTime: mean=14.2ms, stddev=0.8ms, CoV=5.6%

# High CoV (noisy, comparison may be unreliable):
DrawCalls: mean=2400, stddev=480, CoV=20.0%  ⚠ Flagged
When a stat is flagged for high CoV, the report shows a warning. You can still use the comparison, but treat it with caution — the variance is high enough that the delta might be noise.
Thermal Throttle Detection
GPU and CPU thermal throttling causes frame times to gradually increase over the course of a capture. PerfGuard detects this by analyzing the trend slope of frame times over time.
If frame times consistently increase across the capture duration (statistically significant positive slope), the diagnostics card flags potential thermal throttling.
Mitigation strategies:
- Add a cooling period between consecutive scenario runs
- Use shorter captures (15–20 seconds) to avoid the throttle window
- Improve case airflow or use a cooling pad on laptops
- Run CI captures during cooler ambient conditions (nightly, not midday)
Auto-Threshold Recommendations
PerfGuard can analyze your historical run data and recommend thresholds based on the natural variance of each stat. This takes the guesswork out of threshold tuning.
The recommendation algorithm:
- Collects the last N runs for each stat (from history)
- Computes the standard deviation of each stat across runs
- Recommends a threshold at 2–3 standard deviations above zero delta
- Ensures the threshold is high enough to avoid false positives from natural variance, but low enough to catch real regressions
Tuning Per-Stat Thresholds
A single global threshold rarely works well for all stats. Frame time and GPU time are stable; draw call counts fluctuate more. PerfGuard supports project-wide defaults in DefaultPerfGuard.ini and per-stat overrides on each FPerfStatConfig inside the scenario asset (or via suite.json).
Project-wide defaults:
[/Script/PerfGuardRuntime.PerfGuardSettings]
DefaultMaxRegressionPercent=5.0
DefaultMaxRegressionAbsolute=0.0
DefaultWarmupFrames=60
BudgetPreset=None
Per-stat overrides via suite.json (CI) or per scenario asset (editor):
{
  "scenarios": [{
    "name": "MainMenu_Flythrough",
    "thresholds": {
      "FrameTime":      { "max_regression_percent": 3.0,  "aggregation": "p95" },
      "GPUTime":        { "max_regression_percent": 3.0,  "aggregation": "p95" },
      "DrawCalls":      { "max_regression_percent": 15.0 },
      "TrianglesDrawn": { "max_regression_percent": 10.0 }
    }
  }]
}
Tight thresholds (3%) on timing stats catch meaningful regressions. Loose thresholds (10–15%) on count-based stats avoid noise from draw call batching and LOD differences.
Hitch Detection Configuration
Hitch detection thresholds determine what counts as a minor, major, or severe hitch. The defaults are based on the frame budget:
# Minor:  1.0x - 2.0x budget  (16.67ms - 33.33ms)
# Major:  2.0x - 4.0x budget  (33.33ms - 66.67ms)
# Severe: 4.0x+ budget        (66.67ms+)
For VR projects where any hitch is unacceptable, tighten these multipliers. For less latency-sensitive games, you might relax the minor threshold to reduce noise.
Custom CSV Stat Tracking
UE's CSV profiler can output hundreds of columns. PerfGuard tracks whichever columns you specify in the scenario's Stat Configs array. You can track any column that appears in the CSV header.
Common custom stats beyond the defaults:
# Rendering
"SceneRendering"       # Total scene render cost
"ShadowDepths"        # Shadow map rendering
"Translucency"        # Translucent object cost

# Memory
"Physical Memory Used" # Process physical memory
"Texture Memory"      # GPU texture allocations

# Gameplay
"Physics"             # Physics simulation time
"AI"                  # AI tick cost
"Navigation"          # Navmesh queries
Integrating with External Dashboards
For teams that use Grafana, Datadog, or custom dashboards, PerfGuard can output comparison results as machine-readable JSON for ingestion by external systems.
python3 perfguard_cli.py baseline compare MyScenario \
    --csv capture.csv \
    --json-output results/comparison.json
python perfguard_cli.py baseline compare MyScenario ^
    --csv capture.csv ^
    --json-output results\comparison.json
The JSON output contains all stat values, deltas, thresholds, and pass/fail results in a structured format. Feed this into your dashboard pipeline to build long-term performance tracking across hundreds of builds.
{
  "version": 1,
  "scenario": "MainMenu_Flythrough",
  "platform": "Win64",
  "label": "build-1234",
  "timestamp": "2026-01-15T10:35:00Z",
  "overall_passed": false,
  "stats": [
    {
      "name": "FrameTime",
      "aggregation": "p95",
      "baseline": 14.23,
      "current": 15.89,
      "delta_pct": 11.67,
      "delta_abs": 1.66,
      "threshold_pct": 5.0,
      "passed": false,
      "reason": "FrameTime regressed 11.67% (threshold 5.0%)"
    }
  ]
}
perfguard history show command to build trend visualizations in your team's existing monitoring stack. The JSON format is stable and designed for programmatic consumption.
Troubleshooting: High Variance on Simple Scenes
If Capture Quality shows "Poor" with high CoV (e.g. 30%+) and threshold recommendations suggest 20–25%, even though the scene has no changes between runs, this is likely GPU clock instability — not a PerfGuard bug.
Trivially simple scenes (a few cubes, minimal materials) complete in fractions of a millisecond. At sub-millisecond frame times, the GPU fluctuates between power states (GPU Boost), and tiny absolute timing variations become large percentage swings.
Fixes (best to worst):
- Add visual complexity — Give the GPU enough work to stabilize its clock speed. Add geometry, materials with texture sampling, a post-process volume, or particle effects. Aim for at least 4–5ms of GPU time per frame. This naturally drops CoV below 2–3%.
- Increase warmup frames — Longer warmup gives the GPU more time to settle. Set
WarmupFrameson your PerfScenario to 120–180 instead of the default 60. - Accept recommended thresholds — The Threshold Recommendations section in the report shows the minimum threshold for your scene's variance. You can apply these (e.g. 25%), but then only massive regressions will be caught.
How to change thresholds:
- Per-scenario (Editor) — Open your PerfScenario asset, expand the stat entries, set
MaxRegressionPercent - Per-run (CLI) — Pass
--threshold-percent 25.0toperfguard baseline compare - Project-wide — Project Settings → Plugins → PerfGuard →
DefaultMaxRegressionPercent
Troubleshooting: Dashboard Issues
Dashboard buttons are disabled: If buttons show "disabled" or a banner says "Buttons are disabled in static file mode", you opened the HTML file directly via file://. Browsers can't execute commands from static files. Fix: run python3 perfguard_cli.py dashboard to open the interactive dashboard with a local server.
Lost connection to dashboard server: If clicking a button shows an error, the dashboard server process was stopped (Ctrl+C or terminal closed). Fix: run python3 perfguard_cli.py dashboard again to restart.